January 27, 2021
Daily Market Analysis
Market Focus
US stocks ended an up-and-down session slightly lower, weighed down by worries over virus variants and hurdles to a fresh aid package. Futures on the Nasdaq 100 Index jumped afterhours following a strong earnings report from Microsoft Corp. The S&P 500 dropped just over 0.1% on an uneventful day at the index level. Below the surface, sentiment continued to be driven in large part by the retail trading set. GameStop Corp. rallied another 92%, while Pitney Bowes Inc. jumped more than 80% after a comparison to the video-game retailer. Small caps were among the worst performers as traders turned away from bets on an end to Covid lockdowns.
While retail traders continued to pile into stocks with heavy short interest among hedge funds, a host of momentum stocks and fund darlings turned lower. Peloton Inc. lost 6%, Square Inc. fell 3.5% and Roku Inc. slid more than 5%.
Big tech stabilized in the aftermarket hours, with Microsoft Corp. surging 6% after sales topped projections. Amazon.com Inc., Apple Inc., and Facebook Inc. all advanced at least 0.5%.
Global stocks are mostly threading water near record highs as US corporate earnings season gears up this week, with traders also keeping an eye on developments related to the pandemic and its spread. Vaccine coverage won’t reach a point that would stop transmission of the virus in the foreseeable future, the World Health Organization said.
Market Wrap
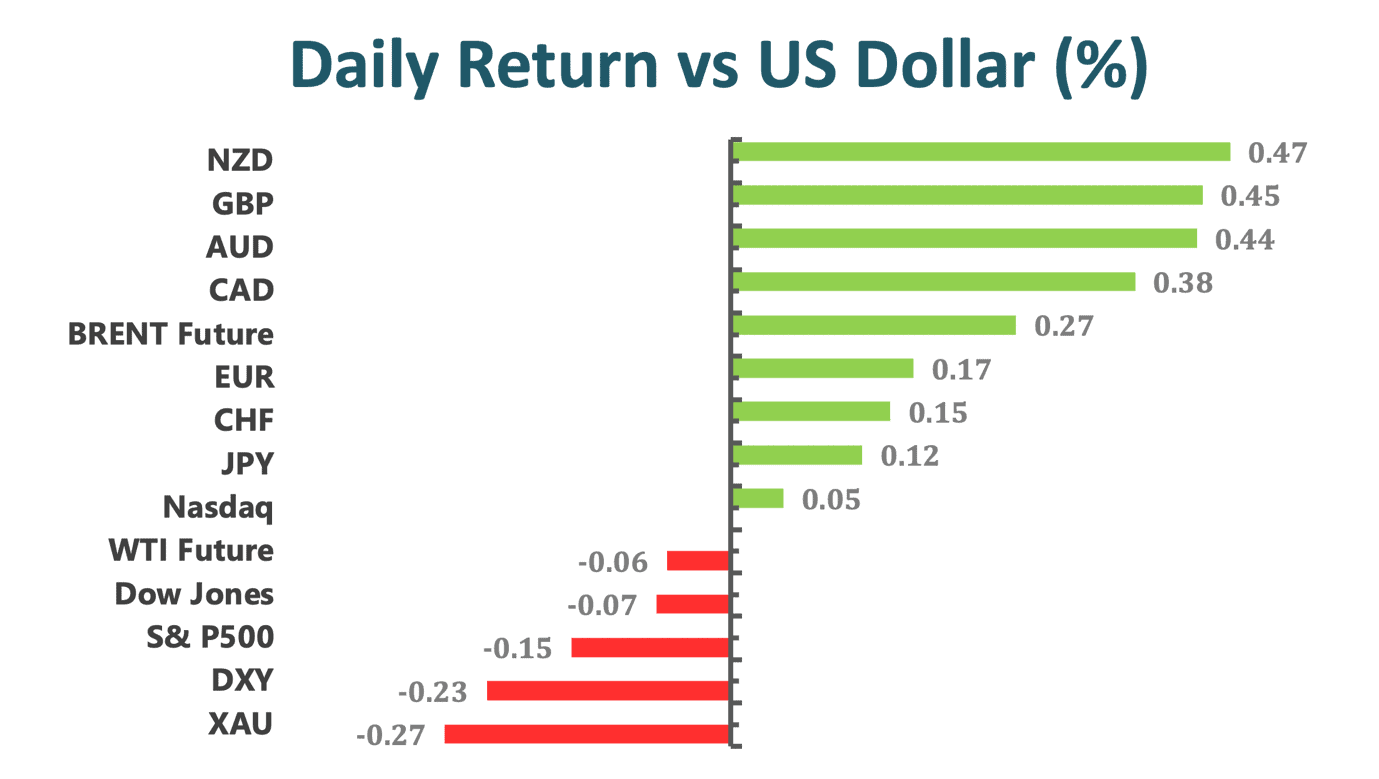
Main Pairs Movement
The broad-based selling pressure surrounding the greenback in the early American session caused the USDJPY pair to slide to a daily low of 103.56. Nevertheless, the pair didn’t have a difficult time staging a rebound and was last seen posting small daily losses at 103.67. The weak USD helped Aussie surge towards the current 0.7450 region. Cautious persist ahead of the US Federal Reserve’s decision. Australian Q4 inflation in focus. USDCAD has slid back from European morning session highs in the 1.2780s to test the 1.2700 level again, as the loonie benefits from weakness in safe-haven currencies (including the US dollar) amid a broad recovery in risk appetite since the start of European session.
It’s been another mixed day for crude oil markets as traders weigh up conflicting narratives. WTI managed to recover back to the north of the $53.00 level at one point, seemingly in line with a recovery in broader risk appetite that also saw stocks rising and the US dollar falling but has fallen back to the $52.50s in recent trade. The inability of USD bulls to push further north of recent tops in the 91.00 region in past sessions prompted sellers to return to the markets and shifted the attention to the potential continuation of the downtrend.
Technical Analysis:
GBPUSD (4 Hour Chart)

The Cable rises above 1.37 and has been trading comfortably around 1.3725 as both market mood improves in anticipation of US stimulus and UK jobs figures beat the market expectation. Although the Cable pair was under pressure during the early European session, bottoming around the lows of 1.36, the broad-based greenback weakness inevitably boosted the GBPUSD’s price. One of the main reasons that improved the GBPUSD was the positive turn in the market sentiment. Because Moderna announced that it would soon begin to investigate a booster vaccine shot and that the Pfizer is also reported to be looking into a booster dose, investors’ confidence strengthened and the demand for USD wore off. From a technical perspective, the recent rally of Cable is supported by the 15-Day SMAVG and the MACD histogram. Additionally, the RSI is fluctuating around the low 60s, which indicates that there is still room for the GBPUSD to advance further. If the GBPUSD can find acceptance above 1.3745, the next resistance would be found at 1.3767, a price level last seen at Apr 2018. On the flip side, if the GBPUSD reverses its recent momentum, the most immediate cushion can be found at 1.3693, 1.3645, and 1.3606.
Resistance: 1.3745, 1.3767
Support: 1.3693, 1.3645, 1.3606
EURUSD (4 Hour Chart)

Just like the Cable, the EURUSD has reversed significantly from the pair’s early lows at 1.2100 lows and is now trading near 1.2165 resistance level. While the US Consumer Confidence data for January is released today (the actual result beats the forecasted number (89.30 to 89.00), the markets largely ignored the data. The main driver for the risk appetite is the positive shift in the tone of the news covering the Covid-19 front. Technically speaking, the bullish momentum of EURUSD is supported by the 15-Day SMAVG. However, given that the RSI is now hovering around the 50s threshold, the prior trading bias for the pair has receded. On top of that, since a pin bar had formed prior to the current tick, it is inferable to say that if the EURUSD fails to penetrate the 1.2165 resistance, a decline in the EURUSD price is quite likely. Therefore, it would not be prudent to place any long positions before a confirmative rally is staged. From the upside, the next resistance can be seen at 1.2165, 1.2182, and 1.2207. Conversely, the support levels for the pair are found at 1.2116, 1.2077, and 1.2054.
Resistance: 1.2165, 1.2182, 1.2207
Support: 1.2116, 1.2077, 1.2054
XAUUSD (4 Hour Chart)

Although the greenback was on the back foot ever since the early US session, the XAUUSD pair seems irresponsive to the change in the market sentiment and has been trading in a tight range for the second straight day. It seems like the pair is having quite a difficult time to make a decisive move in either direction, at the time of writing, the pair is still struggling to make a move between $1859 and $1849. From a technical perspective, the RSI is bouncing around the 50s, suggesting that there is yet to have a trading bias developing at the moment. However, knowing that the 20-Day SMAVG is now hovering above the 60-Day SMAVG, a slightly bullish trend for the XAUUSD can be expected. If the Gold manages to break above the $1859 resistance, the following resistance levels are $1875 and $1891. Conversely, if the XAUUSD dives deeper, the upcoming supports are $1849, $1842, and $1824.
Resistance: 1859, 1875, 1891
Support: 1849, 1842, 1824
Economic Data
|
Currency
|
Data
|
Time (TP)
|
Forecast
|
|
AUD
|
CPI (QoQ) (Q4)
|
08.30
|
0.7%
|
|
USD
|
Core Durable Goods Orders (MoM) (Dec)
|
21.30
|
0.5%
|
|
USD
|
Crude Oil Inventories
|
23.30
|
0.603M
|
| |
|
|
|
| |
|
|
|
| |
|
|
|
| |
|
|
|
| |
|
|
|
|
|
|
|
| |
|
|
|
|
|
|
|
| |
|
|
|
|
|
|
|


