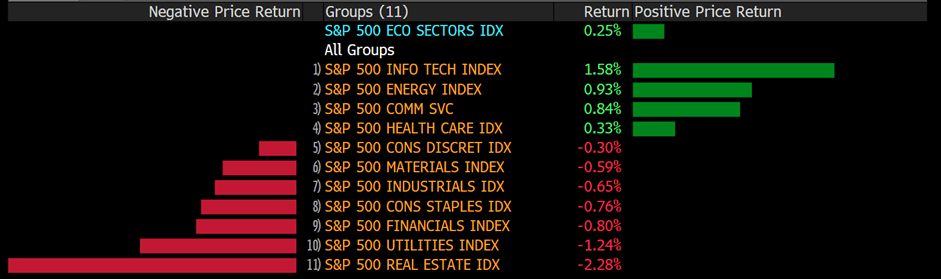
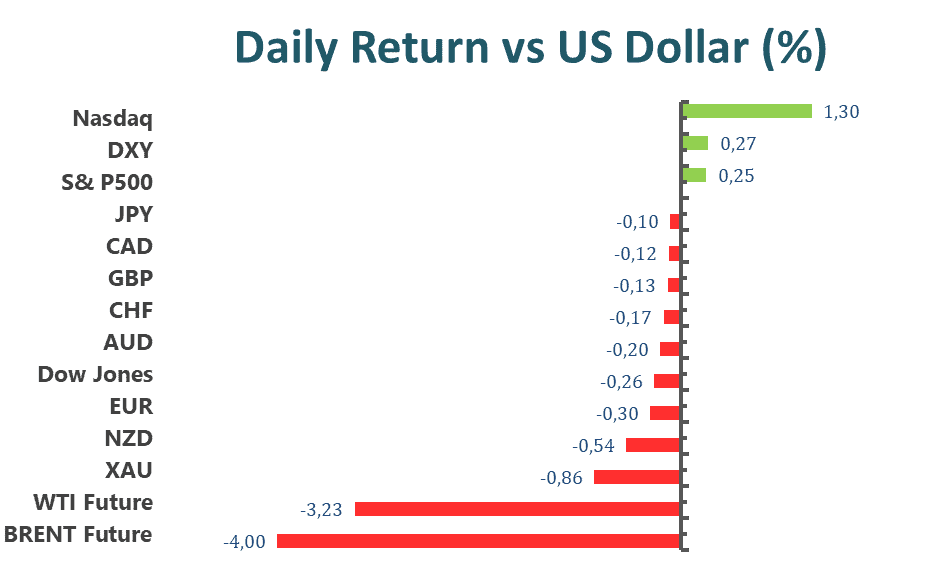
U.S. equities rebounded slightly throughout yesterday’s trading. The Dow Jones Industrial Average rallied 500 points at the start of trading, but the index could not retain its upward momentum and closed 0.26% lower at 32160.74. The S&P 500 edged 0.25% higher to close at 4001.06. The Nasdaq composite climbed 0.98% to close at 11737.67. The benchmark U.S. 10-year Treasury yield cooled off and is now sitting at 2.99%.
The highly anticipated U.S. April CPI figure will be released later today during the American trading session. Currently, analysts are estimating a lower figure than the March reading of 8.5%. Gasoline, shelter, and food accounted for the largest increased area for the March CPI reading; therefore, cooling commodity and energy prices during April could help the case of a lower CPI reading.
Cryptocurrencies recovered slightly after the panic sell-off by market participants due to worries over UST and its Bitcoin reserves. The broad market selloff was triggered by rumors of a possible Bitcoin “dump” by UST creators to prop up UST’s peg to the U.S. Dollar.
Main Pairs Movement
The Dollar index climbed 0.16% throughout yesterday’s trading, despite falling U.S. Treasury yields. The Greenback continues to be in high demand as market participants attempt to hedge interest rate and exchange rate risks.
EURUSD fell 0.3% throughout yesterday’s trading. The Euro failed to maintain any upward momentum and all gains from the two previous trading days were erased. The ongoing war between Ukraine and Russia still acts as extremely heavy pressure on the Euro.
GBPUSD fell an additional 0.16% during yesterday’s trading. Cable is now on its fourth consecutive losing day, after the large sell-off of the Pound last Thursday. The BoE’s pessimistic economic guidance continues to spook market participants.
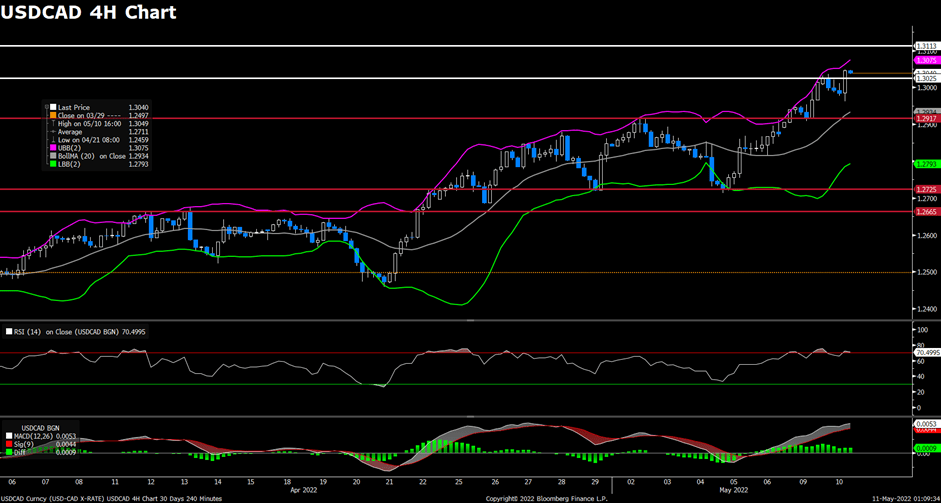
USDCAD gained 0.14% throughout yesterday’s trading. Commodity prices continue to fall with the WTI falling below the key 100 Dollar/ Barrel mark. Technical indicators on the four-hour chart, however, do indicate a possible path reversal for the USDCAD pair.
Technical Analysis
EURUSD (4-Hour Chart)
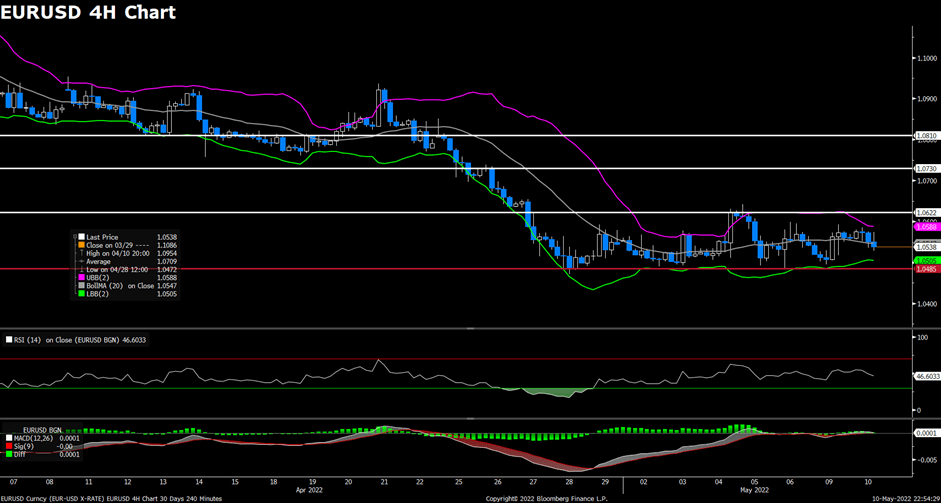
The EUR/USD pair edged lower on Tuesday, losing its recovery momentum in the second half of the day as market participants pay close attention to comments from Fed officials. The pair was trading higher and touched a daily high above the 1.058 level in the Asian session, but then failed to preserve its upside traction heading into the US session. The pair is now trading at 1.0539, posting a 0.18% loss daily. EUR/USD stays in the negative territory despite the generally positive tone around the equity markets, as renewed US dollar strength exerted bearish pressure on the EUR/USD pair. The market focus now shifted to the release of the US CPI report on Wednesday. For the Euro, the concerns about the Russian invasion of Ukraine and the effect it brought on oil and gas supplies might both keep acting as a headwind for the EUR/USD pair, as the European Commission continues to discuss a full oil embargo on Russia.
For the technical aspect, the RSI indicator is 46 figures as of writing, suggesting that the downside is more favored as the RSI stays below the mid-line. As for the Bollinger Bands, the price failed to climb higher and dropped towards the moving average, therefore the downside traction should persist. In conclusion, we think the market will be bearish as long as the 1.0622 resistance line holds. The falling RSI also reflects bear signals.
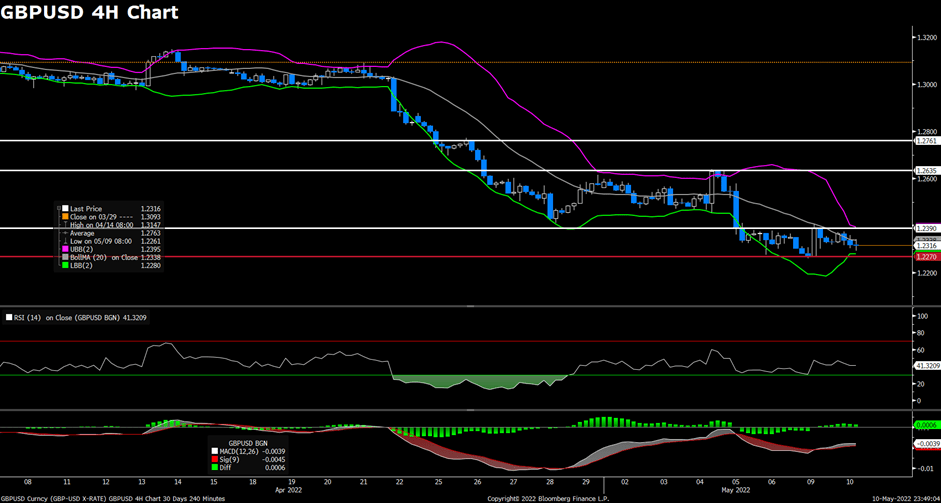
The pair GBP/USD declined on Tuesday, failing to preserve its upside momentum amid a negative shift witnessed in market sentiment. The pair started to see fresh selling after reaching a daily top above the 1.237 level, then extended its daily losses and dropped towards the 1.230 mark during the US session. At the time of writing, the cable stays in negative territory with a 0.14% loss for the day. The US dollar continued to be underpinned by the prospects for a more aggressive policy tightening by the Fed, as investors expect that the Fed will take more actions to curb soaring inflation. This helped the greenback to find demand and weighed on the GBP/USD pair. For the British pound, the Bank of England’s gloomy economic outlook and recession fears continued to act as a headwind for the cable. The falling 10-year UK government bond yield is also making it more difficult for the British pound to find demand.
For the technical aspect, the RSI indicator is 41 figures as of writing, suggesting that the pair is facing selling pressure as the RSI stays below the mid-line. For the Bollinger Bands, the price struggled to rise above the moving average and now sitting below it, indicating that the downside traction should remain. In conclusion, we think the market will be bearish as the pair is heading to test the 1.2270 support. The flattened RSI also indicates the lack of buyers’ interest. On the upside, 1.2390 forms the first resistance ahead of 1.2635 and 1.2761.
Despite retreating US bond yields today having limited the upside for the US dollar, the pair USD/CAD witnessed fresh buying and extended its daily gains in the US session. The pair dropped to a daily low below the 1.297 mark at the start of the US session, then regained bullish momentum and erased all of its daily losses. USD/CAD is trading at 1.3038 at the time of writing, rising 0.19% daily. Investors now await the release of US consumer inflation figures on Wednesday, which will play a key role in driving the USD demand. On top of that, sliding crude oil prices also undermined the commodity-linked loonie and provided some support to the USD/CAD pair. WTI extended its daily losses as growing recession risks and lockdowns in China have both dampened the global oil demand, now sitting below $100 per barrel.
For the technical aspect, RSI indicator 71 figures as of writing, suggesting that the pair is facing heavy buying pressure and stays in the overbought zone now, so a trend reversal could be expected. As for the Bollinger Bands, the price started to rise towards the upper band, therefore the upside momentum should persist. In conclusion, we think the market will be bullish as the pair is now testing the 1.3025 resistance. The technical readings will favor the upside if the pair could develop well above that resistance.