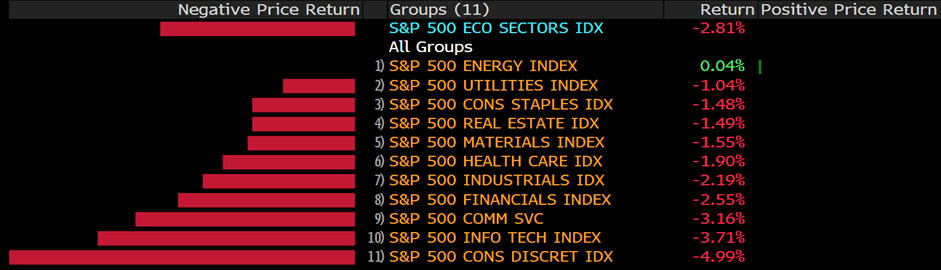
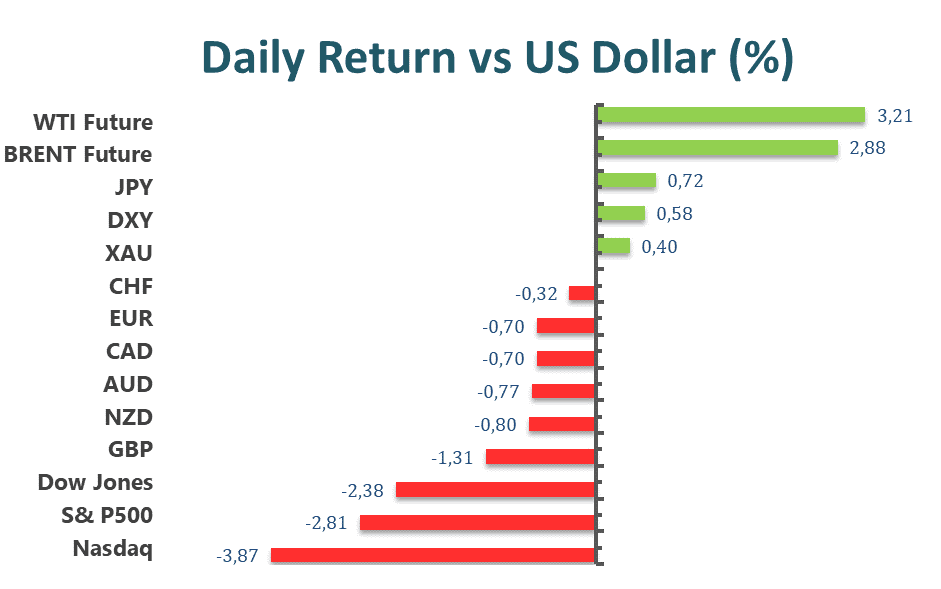
Wall Street benchmark indices plunged on Tuesday, speeding up April’s sell-off on US equities as market participants weighed a flurry of corporate reports against inflationary pressures and worries over recession risks. S&P 500 closed the day by 2.8% lower, while Dow Jones slid around 800 points, resuming its losing streak after slightly rebounded on Monday. The tech-heavy Nasdaq Composite nosedived nearly 4%, being its third-biggest drop of the year and marking its lowest close since December 2020.
Russia will cut off the gas to Poland and Bulgaria on Wednesday in a major escalation in the standoff between Moscow and Europe over energy supplies and the war in Ukraine.
Moscow is making good on a threat to halt gas flows to countries that refuse President Vladimir Putin’s new demand to pay for the fuel in rubles. The European Union has rejected the move in principle but now payment deadlines are starting to fall due, governments across Europe need to decide whether to accept Putin’s terms or lose crucial supplies — and face the prospect of energy rationing.
European gas prices surged as much as 17% as traders calculated the risk of other European countries being hit next.
“This is a turning point that has been accelerated by Russia today,” said Piotr Naimski, Poland’s top official for strategic energy infrastructure. The threat of cutoffs has been looming for weeks, but there was an indication last week that the EU was suggesting a potential way out of the standoff. The move against bloc members Poland and Bulgaria probably makes some kind of compromise less likely. It also removes from the EU’s toolkit the option of sanctioning Russian gas.
The focus now turns to other European capitals, particularly Germany, which is heavily dependent on Russian gas. There was no immediate reaction from Berlin.
Main Pairs Movement
Forex trading continues to be dominated by risk-off funds. Recently, China’s blockade risk, the ongoing Russia-Ukraine war, deteriorating global growth prospects and aggressive monetary tightening by many major central banks have all weighed on market sentiment.
USD/JPY started to pull back from last week’s high above 129.00 to around 127.00 and EUR/JPY hit 135.00 in two weeks. Meanwhile, GBP/JPY extended its three-day decline from last week’s highs above 168.00 to nearly 5.0%. The US Dollar Index (DXY) hit a new high at 102.30, driven by declines in the Euro and the British Pound, the two worst performers among the major G10 currencies.
The other major G10 currencies such as AUD, NZD, and CAD all outperformed GBP, each falling around 0.6% against the USD on the day, with losses cushioned by higher energy prices due to geopolitical tensions. AUD/USD pair dropped to an intraday low around 0.7130 and NZD/USD fell under 0.66, back to the 11-week low area.
Technical Analysis
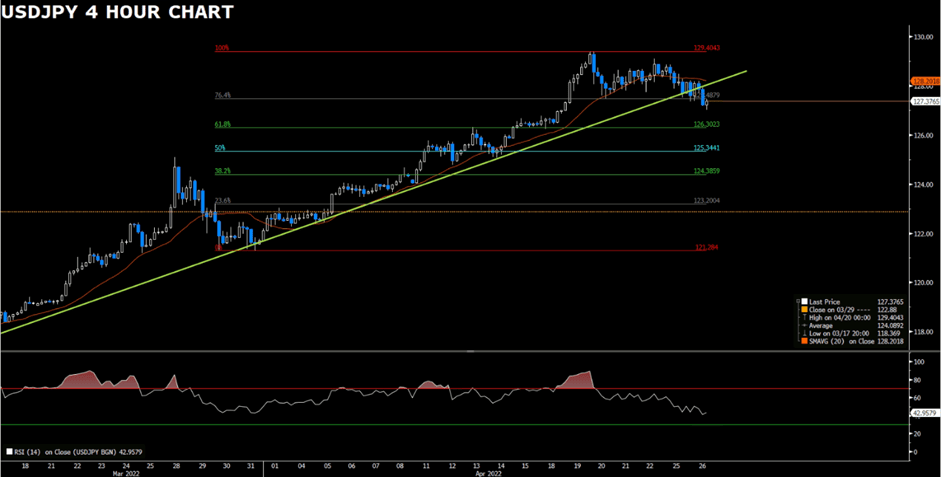
USDJPY (4-Hour Chart)
USDJPY edges lower for the second successive day, dropping to a weekly low on Tuesday. The risk-off mood seems to benefit the JPY and favor bearish traders for USDJPY at the moment; however, the divergent monetary policies between the Fed and the BOJ should limit losses. From the technical perspective, the near-term outlook of USDJPY looks bearish, given the overnight breakthrough and an ascending trend line. At the same time, the RSI has not yet reached the oversold territory. Hence, some follow-through selling would set a stage for an extension of the corrective pullback. On the flip side, the level at 127.41 now acts as an immediate resistance ahead of the ascending trend- line and the 60 Simple Moving Average now also acts as a pivotal point for short-term traders.
Resistance: 129.40
Support: 127.41, 126.30, 125.34
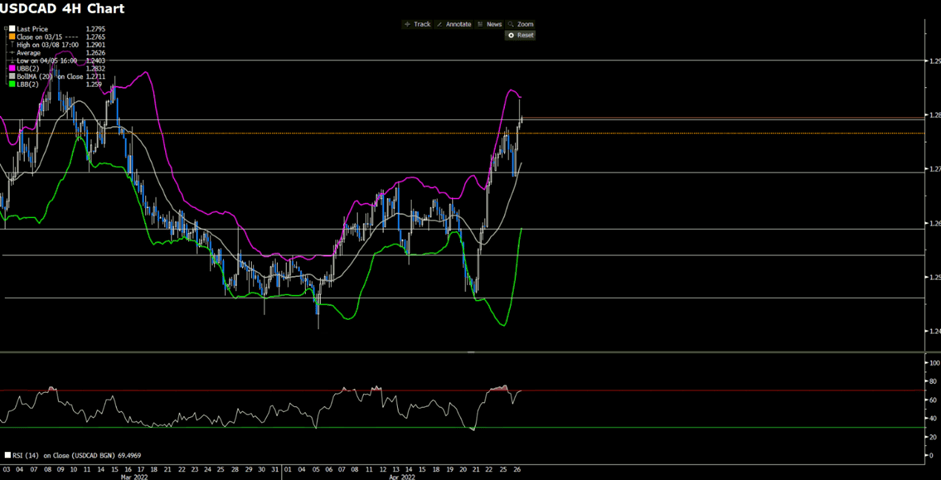
USDCAD (4-Hour Chart)
USDCAD rallies from the daily swing low, and shoots above the 1.2800 regions. The US dollar continues to benefit from the bet for a more aggressive monetary policy by the Federal Reserve, boosting the US dollar to the highest level since 2020. Technically speaking, Monday’s downfall was seen as a fresh trigger for bullish traders. The outlook retains its upside momentum following the retreat from the pivotal support near 1.2700. At the time of writing, the acceptance level above the current hurdle at 1.2800 would give USDCAD another support prospect for a further appreciating move; however, the upside momentum might see limitation as the RSI has nearly reached the overbought territory, suggesting a technical correction.
Resistance: 1.2800, 1.2900
Support: 1.2700, 1.2587, 1.2461
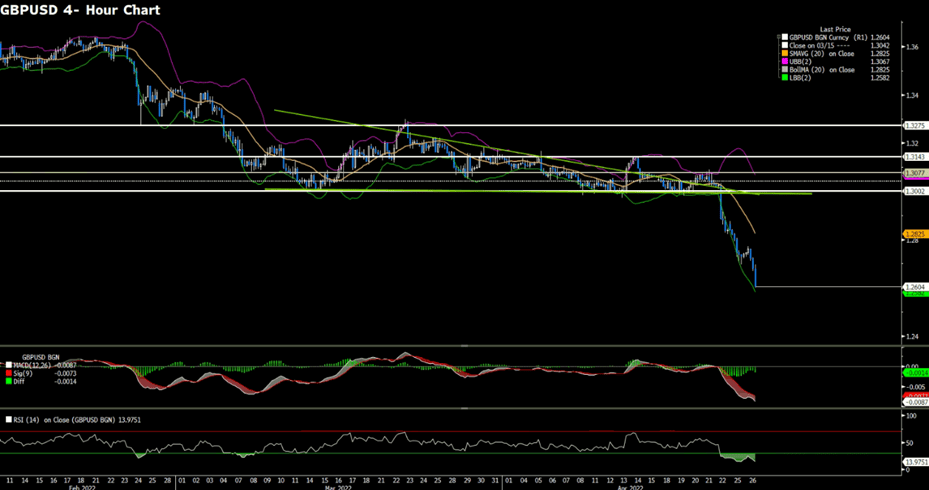
GBPUSD (4-Hour Chart)
GBPUSD slumps further south below 1.2700 on Tuesday following the escalating fears over supply-chain issues ramping up global inflation with the lockdown in China. From the technical perspective, GBPUSD has met fresh selling pressure, breaking through the psychological support at 1.2700. At the moment, GBPUSD trades near the 1.2600 level, the lowest level since July 2020. Despite the RSI indicator on the four-hour chart suggesting a potential recovery, the bearish momentum seems to continue taking control. At the moment, GBPUSD needs to clear the static resistance that seems to have formed at 1.2674 in order to take its recover.