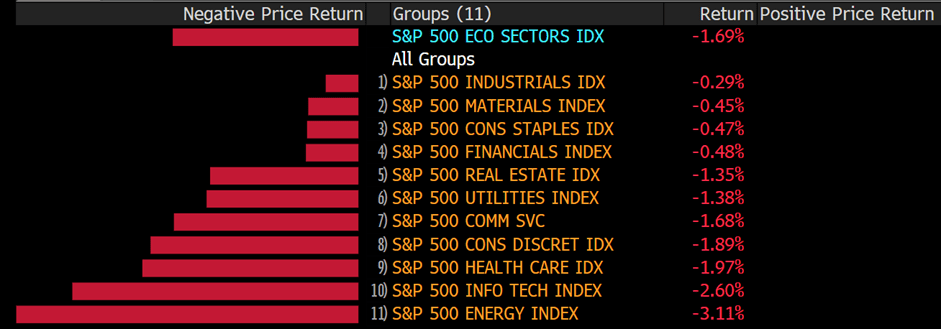
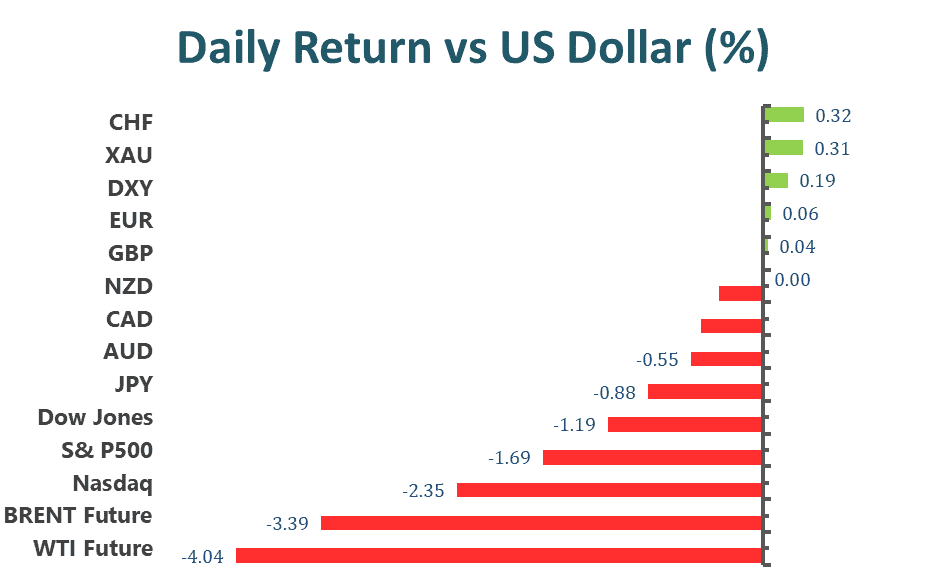
U.S. equities slipped Monday as investors shifted attention to the upcoming earnings season and a heavy economic calendar this week as the US Fed is ready to speed up its moves to fight inflation. The S&P 500 lost 1.69% on top of its last week’s losses. Nasdaq plummeted over 2% as big techs encountered fresh selling pressure. Dow Jones dropped the least, only down 11.19% thanks to its defensive industrial components.
The feel-good days for global markets at the end of March seem over. Everything from stocks to bonds is tumbling — even oil has pulled back from near records – in a concerted cross-asset selloff with shades of the rate-spurred rout of October 2018.
Blame it on a Fed focused on constraining policy to tamp down the worst inflation in four decades, even if that affects economic growth. Unlike four years ago, when Chair Jerome Powell faced market upheaval that would finally force him to change policy, investors in recent weeks have been treated to one Fed official after another guaranteeing higher and higher rates.
With monetary support swiftly diminishing and recession chances growing, investors are hunkering down. Companies resilient to an economic downturn such as health care are back in favor, as well as cash and dividend-paying companies. Meanwhile, demand for hedging is creeping up in the options market.
“The common factor in each situation is the fear of recession, which has overtaken the conventional effect of rising interest rates,” said Robert DeLucia, senior economic adviser at Empower, a retirement services company. “We are seeing a stampede into defensive companies and an aversion to economically sensitive stocks.”
Main Pairs Movement
At the start of the week, attitudes were negative, with the US dollar initially weakening but then regaining strength against its key rivals. Yields increased in reaction to concerns about soaring inflation and the Federal Reserve’s forceful response. Recession is audible, as investors are scared away by prior yield curve inversions, which are thought to be a precursor to economic recession. The 10-year Treasury note yield peaked at 2.793 percent, while the 2-year note yield reached 2.594 percent.
The EUR/USD and GBP/USD currencies concluded the day at 1.0880 and 1.3020, respectively. The weakest performances were commodity-linked currencies, with AUD/USD falling to the 0.7410 price zone and USD/CAD rising to 1.2636. Demand for safety pushed the USD/CHF pair lower, to around 0.9300. However, rising US government bond yields aided the USD/JPY to a new multi-year high of 125.76, where it is currently trading a few pips below the previous high.
In terms of commodities, gold continues to hover around $1,950 per troy ounce, clinging to Monday gains. Crude oil prices fell substantially on Monday, with WTI closing at $95.17 and Brent at $99.35. Cryptocurrencies are also declining, with the benchmark bitcoin going below the vital $40,000 threshold and Ethereum falling below the important $3,000 mark.
Technical Analysis
AUDUSD (4-Hour Chart)
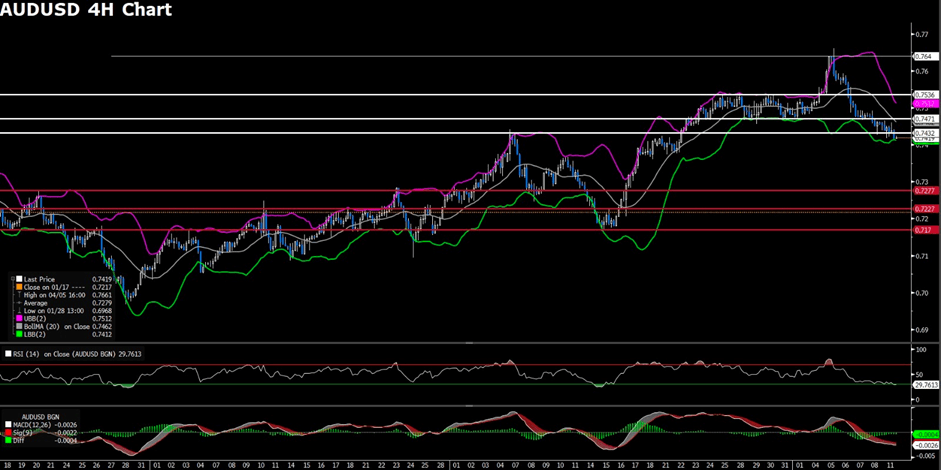
AUDUSD continues to decline following a higher China CPI at 1.5%. From the technical perspective, the four-hour outlook of AUDUSD turns downside as the currency pair breaks its support pivot at 0.7432. However, as the RSI indicator has reached the oversold territory, any meaningful pullback might attract fresh buying near the 0.7400 mark. In the meantime, AUDUSD also trades in the lower band of Bollinger Band, prospecting a retreat from the bottom. Failure to find a decent pullback will bring the pair to the next psychological support at 0.7300, followed by 0.7277.
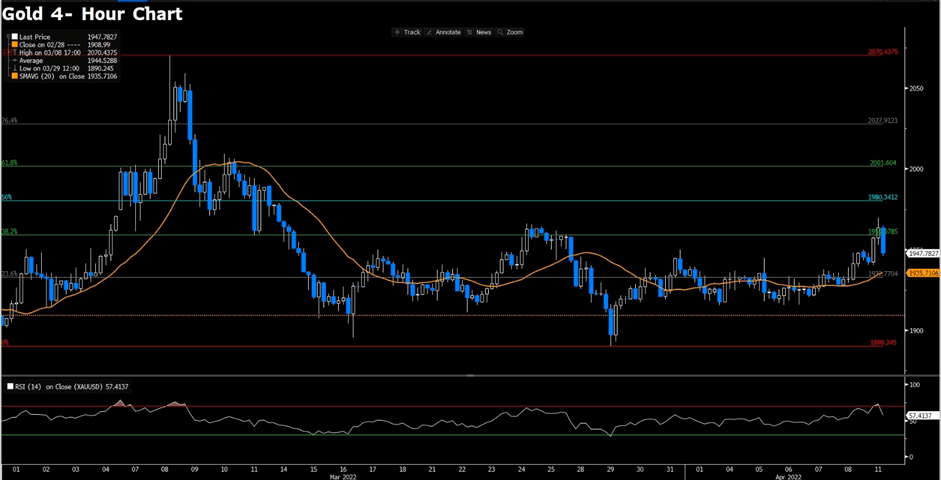
Gold extends daily rally as high as $1960, boosted by the souring market mood amid recession fears and tensions between Russia and Ukraine. From the technical perspective, the four-hour outlook of gold turns upside following the breakout of the consolidated phase and the sustainably trade above the 20 Simple Moving Average. In order to sustain its bullish tone, gold needs to find an acceptable level above the immediate hurdle at $1959, 38.2% of the Fib. Retracement. On the flip side, the immediate support is pegged near $1934; failure to defend the level could negate prospects for any further near-term appreciating price action.
Resistance: 1959, 1980, 2001
Support: 1934, 1890
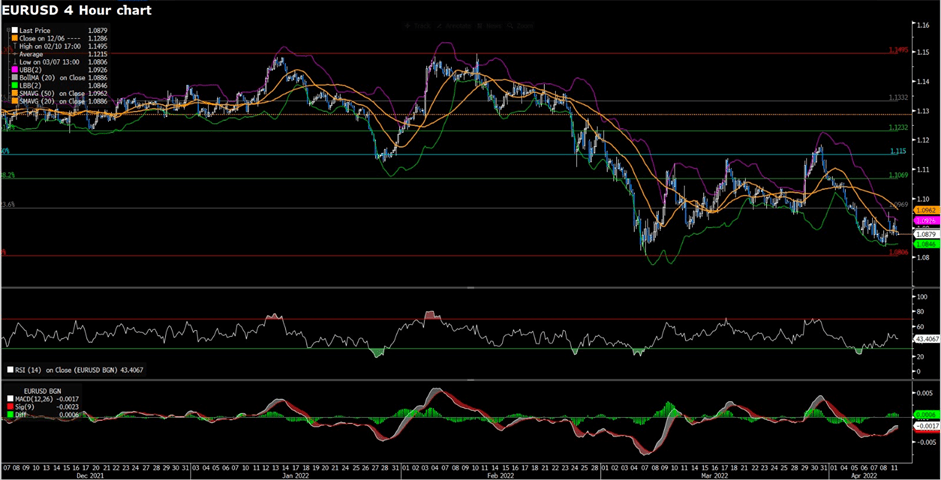
EURUSD (4-Hour Chart)
EURUSD loses traction amid the broad US dollar strength, boosted by the risk sentiment and the rising Treasury bonds. From a technical point, EURUSD is facing stiff resistance at 1.0969. EURUSD remains under selling pressure and downside as it continues to trade below the 20 Simple Moving Average and trade aligning the lower bound of the Bollinger band. At the time of writing, EURUSD consolidates in the range of 1.0969 and 1.0806 with directionless strength as the RSI reading falls on the midline. To the upside, the pair needs to find an acceptable level above the immediate resistance at 1.0969 in order to attract some fresh buying.