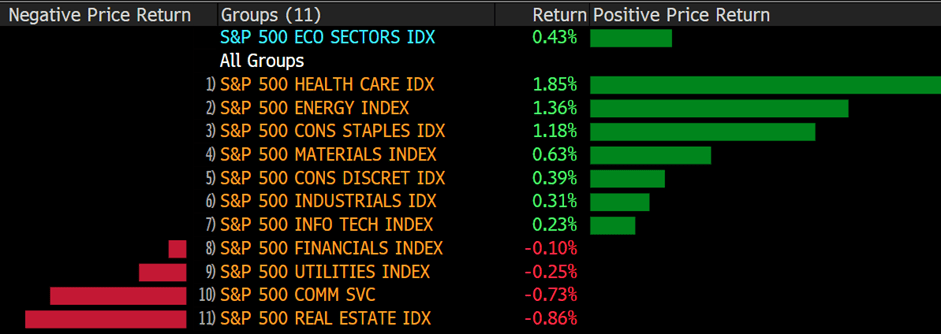
U.S. equities recovered in the final hour of trading Thursday to cap a choppy session in the green as investors continued to digest a hawkish print of minutes from the last FOMC meeting. The S&P 500 shifted losses to rise 0.4%, and the Dow Jones climbed roughly 0.3% after plummeting over 300 points in the first half of the session. The Nasdaq Composite bounced back from a dip of more than 1% to close just above breakeven.
In most of the world, ETFs are simply tools that allow investors to track a certain set of stocks. In Japan, they’ve been tasked with everything from market support and inflation to speed economic growth, promoting corporate governance, and even fostering gender equality.
With such broad objectives, the Japanese central bank has amassed an astounding 80 percent of the country’s ETFs—equivalent to around 7% of its $6 trillion stock market—in less than a decade. This is significantly more than any other central bank in the world has gone to try to stimulate its economy through equity purchases. With $3.7 trillion in net bond purchases, the Bank of Japan has likewise surpassed its peers.
But nine years and a few hundred billion dollars worth of ETF purchases later, the most striking consequence of the world’s boldest monetary experiment may be catastrophic: The BOJ is stuck with a vast portfolio it might not be able to get rid of.
As he prepares to leave away in 2023, BOJ Chair Haruhiko Kuroda remains tight-lipped regarding his exit strategy; the difficult challenge of offloading the BOJ’s position without igniting a big stock selloff will now fall to his successor. It could take decades, if not generations, to do this. Already the largest stock market intervention in central bank history, it has drawn criticism for failing to live up to expectations.
Main Pairs Movement
The sentiments were still dismal as the attention remained on central banks’ hawkishness and tensions between Kremlin and the western world. The US has enlarged its actions against Moscow, hitting Russian Sberbank and Alfa Bank and prohibiting investment in the country by American companies. Meanwhile, the EU has supported a Russian coal embargo, though without officially announcing it. The dollar remained robust.
On Thursday, Ukraine has presented a new agreement proposal, although it includes discussing the situation of Crimea and Donbas, something that Russia considers unacceptable. The European Central Bank has published the Accounts of its most recent meeting. The memo revealed that policymakers believe the bond-buying program has now met its goal and that halting it in the summer would pave the way for a 3Q rate hike.
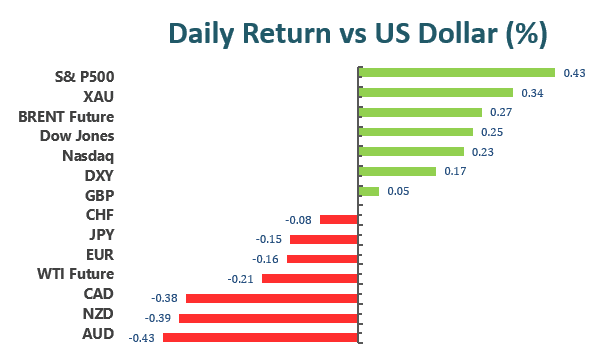
The Euro pair trades around 1.0870, while Cable stands at 1.3070. The dollar gained ground versus its safe-haven counterparts, with USD/CHF trading near 0.8340 and USD/JPY near 124.00. Commodity-linked currencies lost momentum, with the AUD/USD falling to 0.7470 and the USD/CAD rising to 1.2585.
Gold changed hands at $1,934 a troy ounce, up for a third consecutive day higher by 0.33%. Crude oils, on the other hand, kept their price slides at the start of Friday, with WTI trades at $96.40 at the time of writing and Brent at $100.80.
Technical Analysis
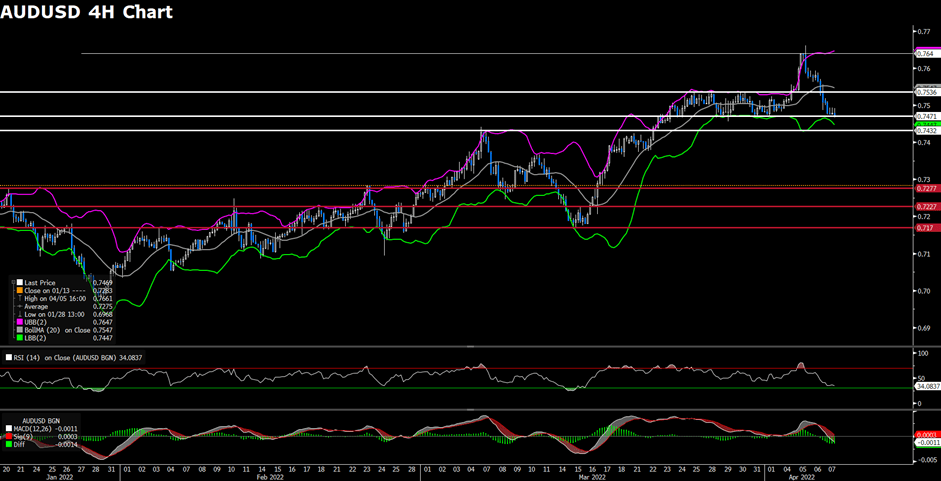
AUDUSD (4- Hour Chart)
AUDUSD continues to retreat, now nearly 200 pips lower since Tuesday’s hawkish RBA. On the four-hour chart, AUDUSD is on the last defensive point to remain in its bullish stance. Failure to defend the immediate support level at 0.7471 will bring the currency pair to the next level at 0.7432. On the upside, with the RSI is nearly oversold and the MACD is edging on the midline, the Aussie might find decent support at 0.7471, or psychological support at 0.7400. The acceptance above 0.7536 will help AUDUSD regain strength. Further price action eye on the tension between Russia and Ukraine and the sanctions from both the US and the EU.
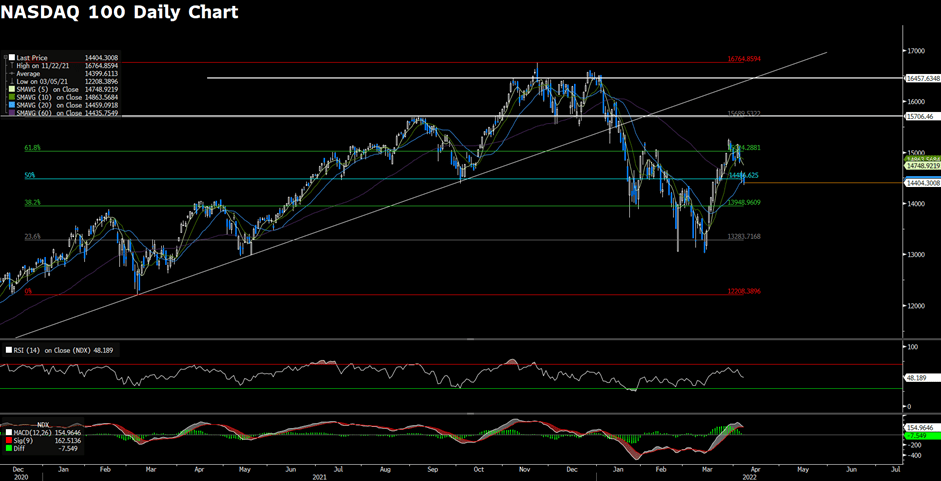
The Nasdaq 100 continues to edge lower for a third day as the time of writing following the Fed signals a speedier policy tightening plan. From the technical perspective, the outlook of the Nasdaq 100 remains upside in the near- term as the MACD remains positive. At the moment, MACD is on the edge of crossing, implying that if the Nasdaq 100 fails to defend the current support pivot at 14486, then it will accelerate further south. On the flip side, the index needs to climb above 15689 in order to reclaim its bullish trend in the longer term.
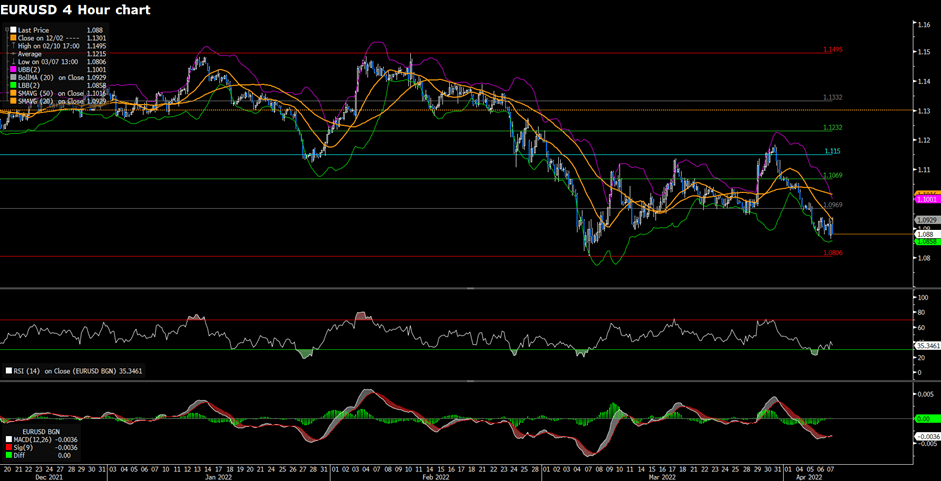
EURUSD erases early gain on Thursday as the tensions are mounting in France’s presidential election race. A Le Pen victory can potentially drag the euro down. From the technical aspect, the outlook of the EURUSD remains bearish as it continues to trade in the lower bound of the Bollinger band. In the meantime, falling below the 20 and 50 Simple Moving Averages also shows that EURUSD is adding another bearish layer. The RSI indicator and the MACD both continue to fall in the negative territory, meaning the absence of dip-buying. Overall, the risk sentiment is sour as the crisis in Ukraine sees no end, boosting the safe- heaven, the US dollar.