January 21, 2022
Market Focus
Wall Street’s major indexes continued their sharp losses on Thursday, especially evaporating late in the session as investors considered whether stocks were cheap after a sell-off at the start of the year and the Nasdaq slipped into correction territory. In addition, the S&P 500’s plummet was largely driven by a slump in consumer discretionary stocks and renewed weakness after tech stocks failed to hold onto their intraday gains for the second day in a row. At the end of the market, the Dow Jones Industrial Average fell 0.89% to 34,715.39 points, the S&P 500 index lost 1.10% to 4,482.73 and the Nasdaq Composite Index dropped 1.3% to 14,154.02 points
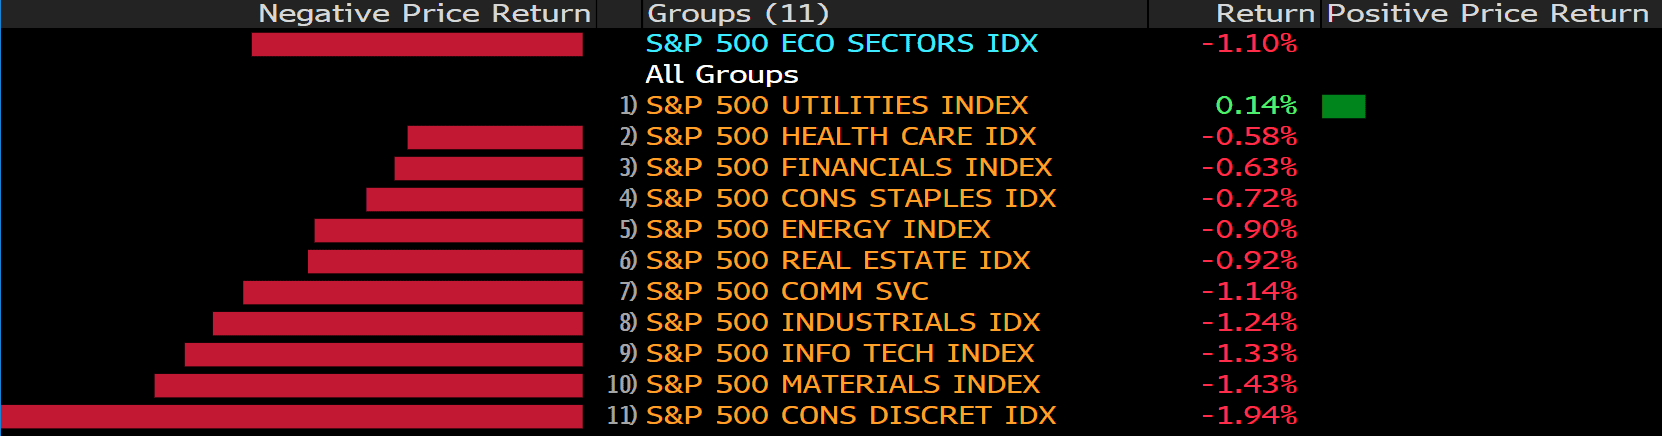
10 of the 11 major sectors in the S&P 500 ended lower, with the consumer discretionary sector down 1.9%, followed by the materials sector, down 1.43%, and the lone winner was utilities, which edged up 0.1%. Consumer discretionary stocks were led lower by Amazon, Garmin and VF Corporation, which lost 1.30%, 6.05% and 5.73%, respectively. On the other hand, the Dow’s worst intraday performances were Dow Inc. down 3.39%, Intel Corp down 2.95% and Home Depot down 2.81%.

Main Pairs Movement:
Disappointing U.S. jobs-related data weakened the dollar in U.S. session, with initial jobless claims unexpectedly jumping to 286K for the week ended Jan. 7, the highest level since late October. But then, as the three major indexes plummeted, the dollar index began to soar and reached around 96.
Sterling was down just 0.1% at the end of the day. A lack of specific data was released, but the pair gained 0.6% intraday as the greenback weakened, but then fell as the greenback strengthened. On Friday, core retail sales data and comments from BOE members may provide some direction on the way forward.
A similar situation occurred in the euro, which rose first and then fell against the dollar. Later in the day, ECB President Christine Lagarde is due to speak, but a rate hike remains less likely.
Gold settled little changed at around $1,840 an ounce but managed to hit a fresh two-month high of $1,847.92 an ounce. Meanwhile, crude prices surged to fresh multi-year highs, with WTI hitting $87.08 a barrel and Brent hitting $89.46 a barrel.
Technical Analysis:
GBPUSD (Daily Chart)

Cable made a mild slide in the Asian session but jumped fiercely at the start of the European trading hours and extended further to the north after the dismal US job data came out, which weighed heavily on the dollar’s demands. The pair now trades around 1.3645, posting 0.23% gains during the intraday trades. The rate competition between the hawkish Bank of England and the Federal Reserve will continue to be the main driver to Cable’s future price actions, as the Fed has announced its rate hike timetable that has been priced in by the market, we expect that GBP/USD to climb further once new BoE hawkish policies being announced. Investors are all eye on the February 3rd BoE meeting.
On the technical front, the RSI for Cable remains around 60, and the pair settles above its 20 and 50 DMA, eyeing on the critical 200-day one. Cable lingers around the 1.3640-50 level at the moment. To the upside, if the pair break through its 200 DMA, the next resistance will be at 1.3830, then 1.3900; on the flip side, if the pair failed to cling on the 1.3600 level, the next effective support will appear at 1.3400, followed by 1.3200, where the one-year lows lie.
Resistance: 1.3734 (200 DMA), 1.3830, 1.3900
Support: 1.36600, 1.3400, 1.3200
EURUSD (Daily Chart)

The euro pair is holding the lower ground below 1.1350, as the US dollar attempts a bounce in tandem with the Treasury yields amid a risk-on mood. The sentiment on Wall Street improved quite a bit, in anticipation of the corporate earnings reports. That fueled a fresh sell-off in the US Treasuries, which in turn, prompted the yields to resume their uptrend. The upturn in the yields lifted the sentiment around the dollar at the euro’s expense. Escalating Russia-Ukraine crisis, with the US imposing sanctions on four Ukrainian officials, accusing them of destabilizing Ukraine, also boosts demand for the safe-haven US dollar.
As to technical, the EUR/USD pair’s price actions shifted to the south, heading to the next retracement line at around 1.1300. The RSI for the pair continues to fall, now reading 47.74, showing a stronger downside pressure weighing on Euro. As previously mentioned, the pair could fell over the 1.1300 support and then season lows around the 1.1200 support. The pair still capped by its 20 and 200 DMA, slight above the 50 DMA.
Resistance: 1.1380, 1.1440,1.1500
Support: 1.1300, 1.1200
XAUUSD (Daily Chart)

Gold price is trading almost unchanged on the day around $1,841 a troy ounce, as it fades its uptick from fresh two-month highs of $1,848. The latest leg down in gold price could be associated with a tepid bounce seen in the US Treasury yields, which helps put a fresh bid under the dollar. Additionally, a broad rebound across markets fuel risk-on flows, dulling gold’s appeal as a safe-haven. Despite the pullback, the yellow metal remains supported by soaring inflation globally and negative real returns, along with escalating geopolitical tensions surround US, Russia and Ukraine amid a probable invasion by the Kremlin of the latter.
From the technical perspective, the RSI bias continues to point to the upside, after breaking the $1830 area on Wednesday. Since the next resistance lies $20 above the current price level, there’s still room for the gold’s traction. As previously mentioned, we expect the short-term uptrend to reach the critical $1,860 resistance, though the downside risk will gradually increase during its climb.
Resistance: 1860, 1900
Support: 1830, 1800, 1765
Economic Data:
|
Currency
|
Data
|
Time (GMT + 8)
|
Forecast
|
|
GBP
|
Retail Sales (MoM) (Dec)
|
14:00
|
-0.6%
|
|
EUR
|
ECB President Lagarde Speaks
|
20:30
|
|
|
CAD
|
Core Retail Sales (MoM) (Nov)
|
21:30
|
1.3%
|
|
|
|
|
|
|
|
|
|
|
|
|
|
|
|
|
|
|
|


