January 14, 2022
Market Focus
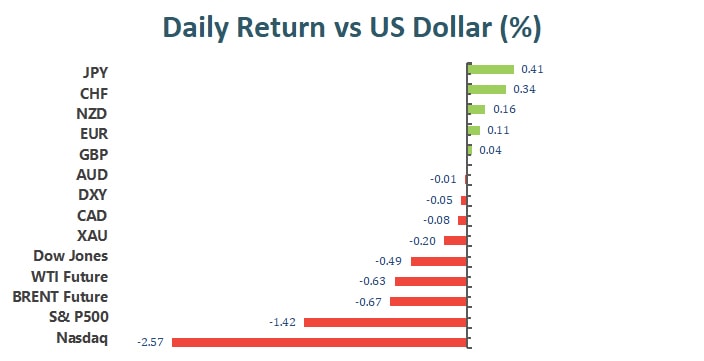
In two economic data releases on Thursday, the PPI rose 0.2%, well below expectations and down from a 1.0% gain in November. In the labor market, weekly jobless claims unexpectedly rose by 23,000, with economists citing the effect of the Omicron variable. The three major indexes ended lower on Thursday, with the Nasdaq leading a 2.5% loss, as investors took profits, especially in tech stocks after a three-day rally, while several Fed officials talked about inflation and interest rate hikes. At the end of the market, the Dow Jones Industrial Average slipped 0.5% to 36,113.63 points, the S&P 500 index fell 1.4% to 4,659.02 and the Nasdaq Composite Index lost 2.5% to 14806.81. The top performers in the Dow Jones Industrial Average were Boeing, up 2.97%, Caterpillar, up 2.07%, and Walmart, up 1.42%. The worst performers in the session were Microsoft, down 4.23%, Salesforce, fell 3.87%, and Apple, lost 1.90%.

Rate-sensitive growth stocks such as technology have lagged market indexes. Among the S&P 500 sectors, the biggest losers on the day were technology, down 2.7%, the consumer discretionary index fell 2% and health care fell 1.63%. The best performers in the S&P 500 were Biogen, up 5.03%, Kroger up 4.96% and American Airlines Group up 4.54%. The worst performers were ServiceNow, down 9.31%, Lumen Technologies down 7.67% and Bio-Techne down 7.16%. On the other hand, in the health care sector, Moderna down more than 5%.

Main Pairs Movement:
The dollar continued its losses on Thursday but weakening risk appetite prevented the greenback from falling further. The dollar’s intraday gains helped correct oversold conditions reached after Wednesday’s sell-off. The dollar index fell 0.2% to 94.791, its lowest since Nov. 10.
Sterling rose 0.11% to $1.372, its highest level since late October, as traders believed the UK economy could withstand a surge in COVID-19 cases and the Bank of England could raise interest rates again as early as next month.
EUR/USD hit 1.1481 and closed near 1.1460. The European economy is adapting to the coronavirus pandemic, ECB Deputy President Luis de Guindos said, and he expects inflation to fall below the ECB’s target in 2023 and 2024.
Gold retreated slightly to settle at around $1,820 an ounce, while crude oil prices were weighed down by weakness in equities, with WTI at $81.70 a barrel and Brent at $84.07 a barrel.
Technical Analysis:
GBPUSD (Daily Chart)

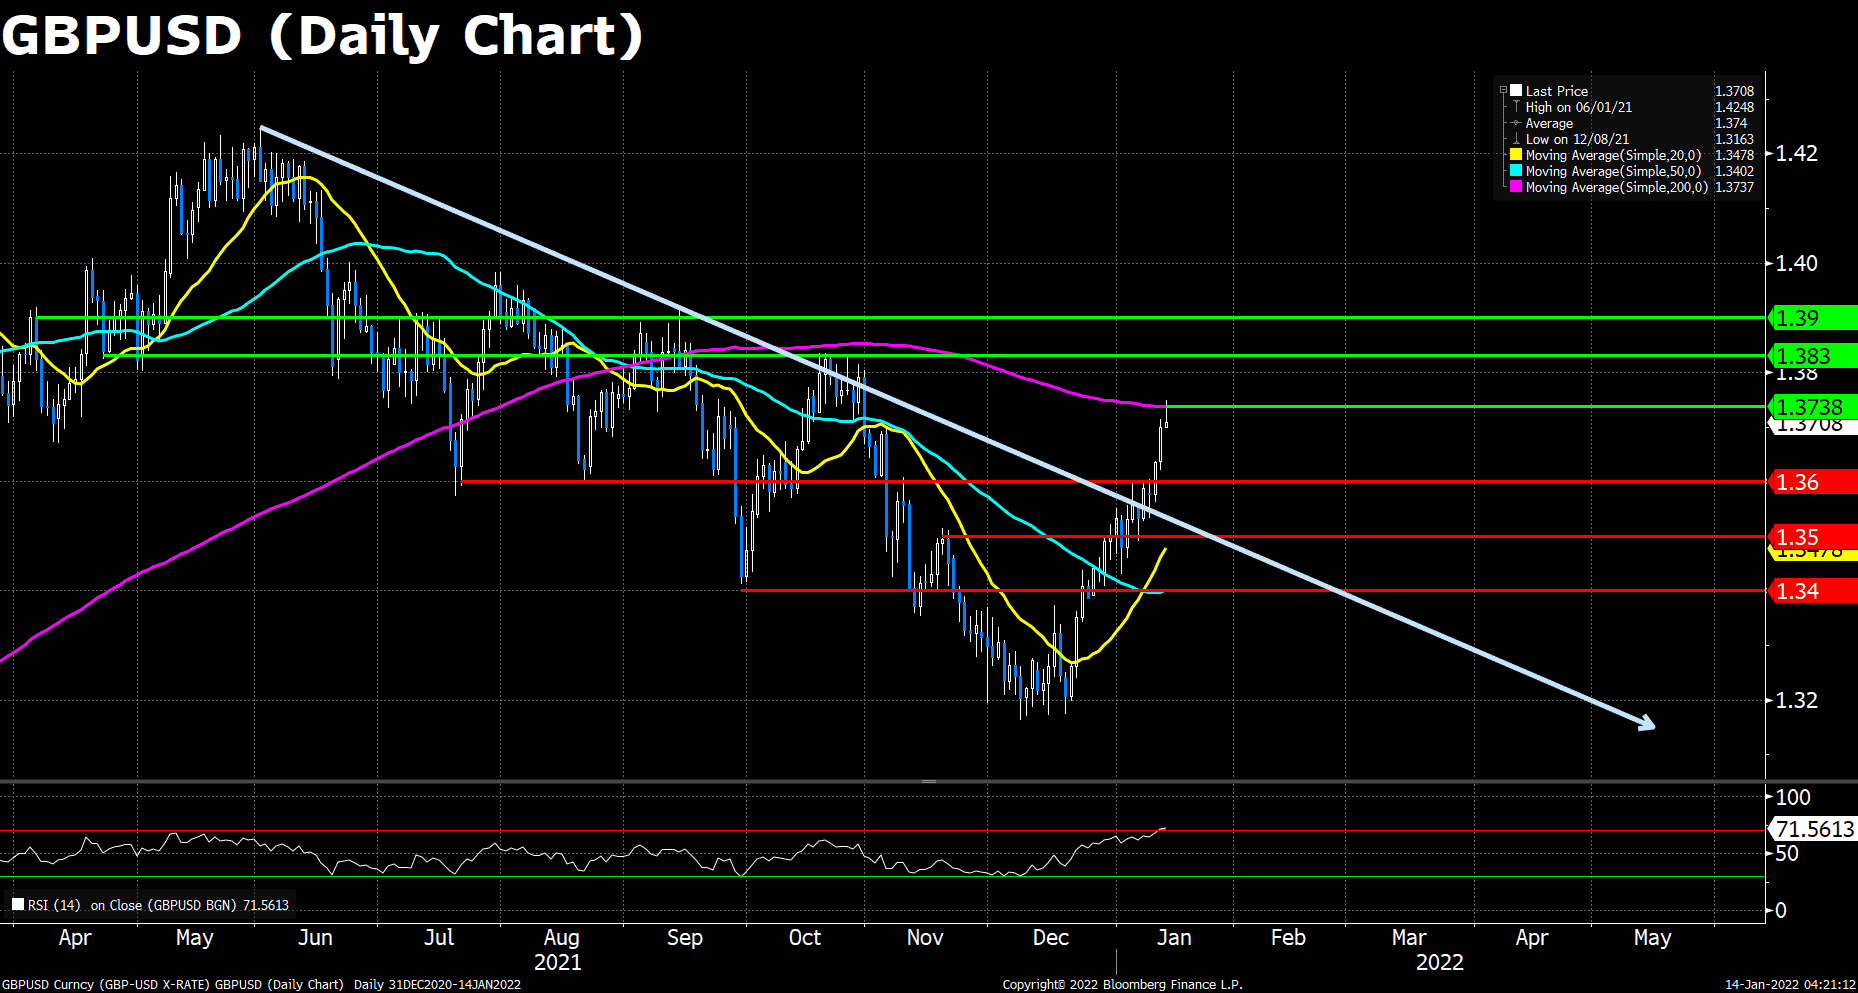
Cable surged for yet another day amid the weakness of the US dollar. The pair touched the daily high at 1.3749, and now trades at around 1.3708 as of writing. It is said that the recent rally of the non-US currencies was due to a squeeze on the market’s excessive long-dollar positioning, as the recent depreciation of the Greenback has seemingly gone against the fundamentals.
On the technical front, the robust 200 DMA resistance forced Cable into a retracement back down just before mid-day on Thursday. The consolidating decline appeared to find support in Wednesday’s close near the 1.3700 level. The RSI for the pair reads 71.56, further into the overbought territory, indicating a near-term correction seemingly inevitable. Despite the potential headwinds, we believed that there’s still rooms for the Pound’s upside in the short term as long as the GBP/USD pair closed the week above its 200 DMA, but further catalysts are needed for the mid-to-long term growth of the Cable.
Resistance: 1.3738 (200 DMA), 1.3830, 1.3900
Support: 1.3600, 1.3500, 1.3400
EURUSD (Daily Chart)

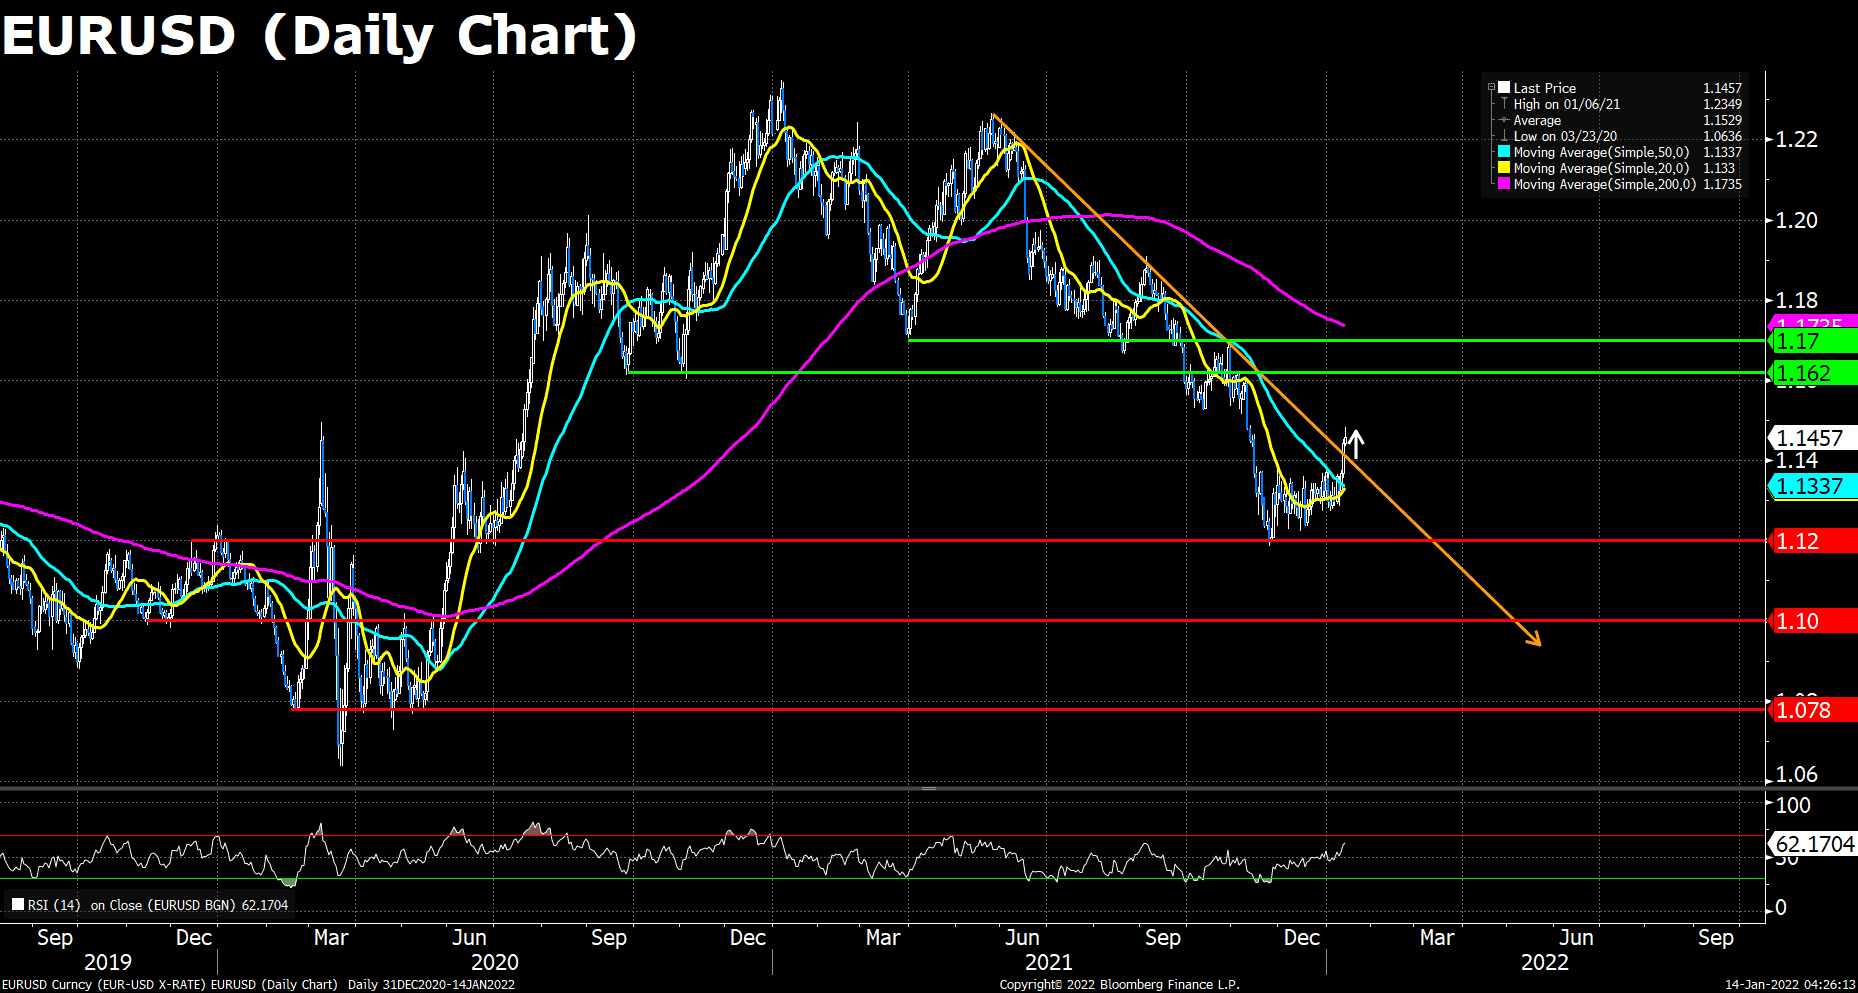
The EUR/USD pair advanced for the third consecutive day amid the worse-than-anticipated US Initial Jobless Claims and December PPI. The ECB Vice President Luis de Guindos said the European economy is getting used to the coronavirus, adding that “perhaps inflation won’t be as transitory as forecast only some months ago.” Although he expects inflation to stay below the ECB’s target in 2023 and 2024, the investors still bet an early rate hike from the ECB when the inflation loses control.
On the technical, the Euro pair went up to around 1.1460 during today’s trading, but the upside momentum seems diminishing. The RSI for EUR/USD is still above 60, suggesting the bulls are still in hope. If the pair managed to cling on the 1.1400 threshold at the end of the week, then we could expected the pair to reach the next resistance level at 1.620; however, if failed, the looming Fed’s hawish monetary policies may push the dollar up, again dragging the Euro pair to the downside.
Resistance: 1.1620, 1.1700
Support: 1.1200, 1.1000, 1.0780
XAUUSD (Daily Chart)

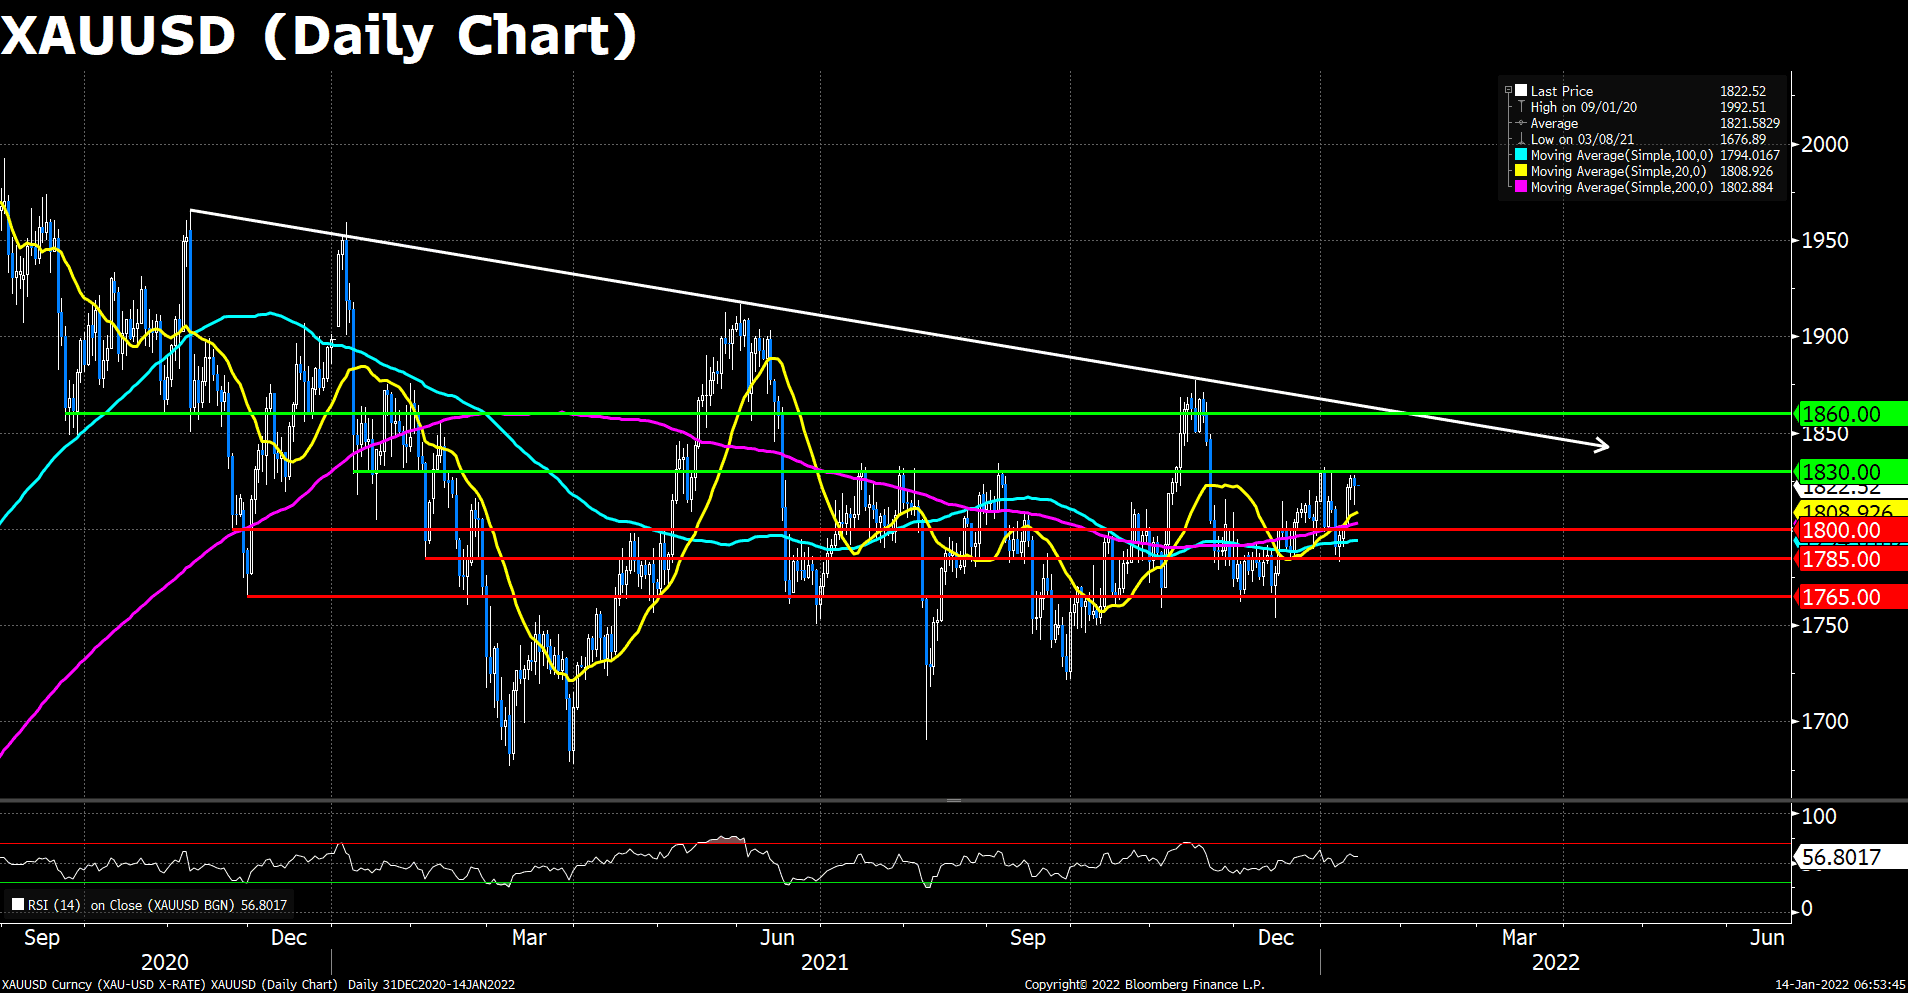
XAU/USD have pared back from early European session highs at the $1,828 mark in more recent trade though have for the most part remained support above $1,820. Some traders have been disappointed at gold’s struggles to benefit from this week’s run of US dollar weakness. The winning streak has run out of steam ahead of this year’s $1830 highs.
As to technical, market sentiments toward the yellow metal remains a slight optimism. The remaining dollar weakness and the dismal equity markets underpinned the gold’s price at the short-term support $1,820. The RSI for gold reads 56.80, showing that the demand for gold still strong. The pair now lies above its 20, 50 and 200 DMAs.
Resistance: 1830, 1860
Support: 1800, 1785, 1765
Economic Data:
|
Currency
|
Data
|
Time (GMT + 8)
|
Forecast
|
|
GBP
|
GDP (MoM)
|
15:00
|
|
|
GBP
|
Manufacturing Production (MoM) (Nov)
|
15:00
|
0.2%
|
|
GBP
|
Monthly GDP 3M/3M Change
|
15:00
|
|
|
USD
|
Core Retail Sales (MoM) (Dec)
|
21:30
|
0.2%
|
|
USD
|
Retail Sales (MoM) (Dec)
|
21:30
|
-0.1%
|
|
|
EUR
|
ECB President Lagarde Speaks
|
21:30
|
|
|
|
|
|
|
|


