December 8, 2021
Market Focus
US stock advanced on Tuesday, making the biggest rally in nine months amid risk-on market sentiment. Investors’ mood turned more upbeat this week as several health experts have said that Omicron symptoms appear milder, and the variant seems won’t derail the global economic recovery. However, the new restrictions to stop the spread of Omicron could still put some pressure on market mood. Meanwhile, US Treasury yields surged on the back of the market’s optimism, with the 10-year Treasury note yielding 1.48% by the end of the day.
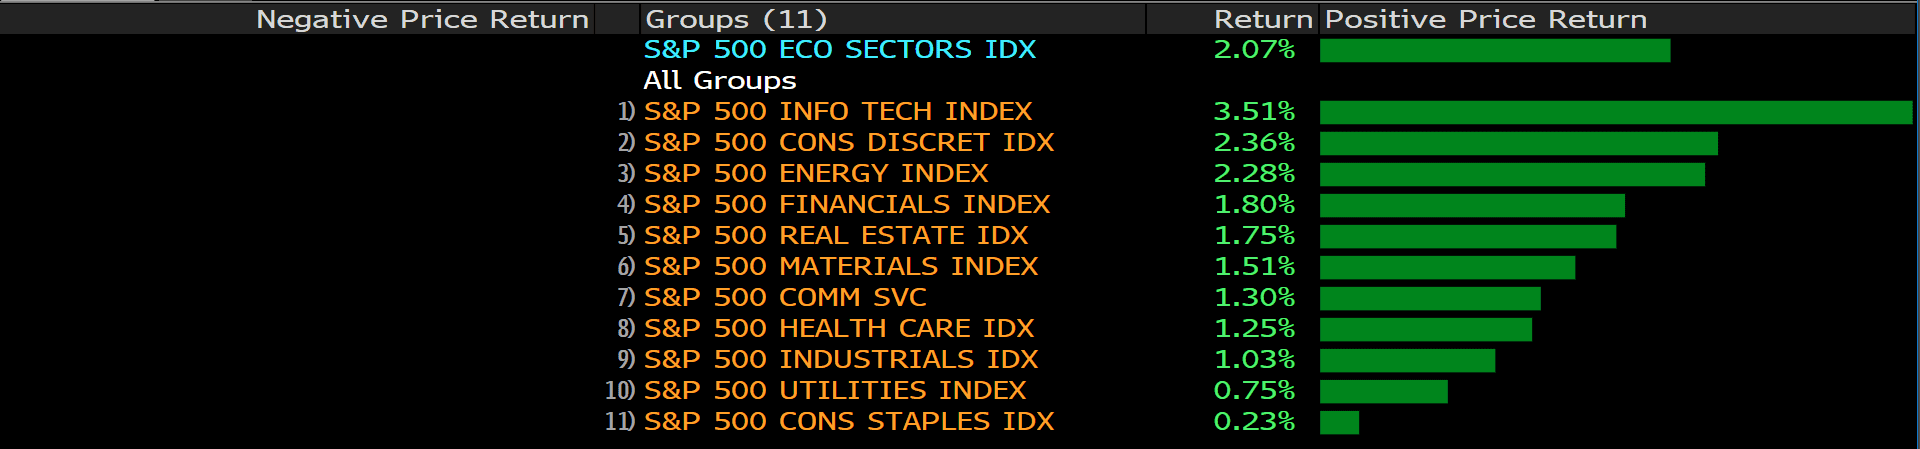
The benchmarks, S&P 500, Dow Jones and Nasdaq both rose on Tuesday as risk assets recovered and the encouraging news about easing Omicron fears acted as a tailwind for the equity markets. S&P 500 was up 2.1% on a daily basis and the Dow Jones Industrial Average climbed with a 1.4% gain for the day. All eleven sectors stayed in positive territory as the information technology and consumer discretionary sectors are the best performing among all groups, rising 3.51% and 2.36%, respectively. The Nasdaq 100 gained the most with 3%.
In Asia, China has pledged measures to support economic growth. Moreover, China’s Trade Balance has eased to $71.72B while the Exports improved from 17.2% to 22.0%, led by a record on external demand and an easing power crunch. In Australia, the RBA decided to keep the benchmark rate unchanged at 0.1% and the weekly bond purchases of $4.0 billion intact until at least mid-February 2022, which is in line with market expectations.

Main Pairs Movement:
The US dollar edged higher on Tuesday, staying in positive territory amid upbeat market sentiment. The DXY index gained bullish traction and touched a weekly high near 96.6 area, but then started to see some selling while surrendered most of its intraday’s gains during American session. Markets now become more optimistic that Omicron will not derail the global economic recovery. However, it’s still too early to say as long as the omicron strain remains a new source of uncertainty.
GBP/USD declined on Tuesday, dropping below 1.325 level amid steady US dollar across the board. The pair reached a daily top in early European session but failed to preserve its bullish momentum. EUR/USD also dropped to a daily low below 1.123 level, as the EU Q3 GDP data failed to impress and made the EUR was the weakest USD rival, losing 0.13% on a daily basis.
Gold recovered some of Monday’s losses and edged higher to $1785 area, holding steady amid upbeat market mood and positive Omicron related-news. The precious metal is now rising 0.13% on a daily basis. WTI oil stayed in positive territory and surged 2.48% for the day, supporting by upbeat sentiment and the fact that the EIA raised its forecast for 2022 world oil demand growth by 200K barrels per day in its latest report.
Technical Analysis:
AUDUSD (4- Hour Chart)

The Aussie rebounds from sub- 0.70000 region for the second successive day. From the technical point of view, the pair looks bullish in the near term as its intraday outlook has breached the bearish channel. The upside momentum is expected to continue, heading toward the immediate hurdle at 0.7116. Afterward, the momentum might need to adjust as the pair is going to hit the upper bounce of Bollinger Band while the RSI is going to reach the overbought condition, due to a pullback.
Resistance: 0.7116, 0.717, 0.7227
Support: 0.6997
BTCUSD (Daily Chart)

Bitcoin edges higher for a third successive day following a devastating weekend’s slump. From the technical aspect, Bitcoin seems to be ready to test its immediate barrier at $55,000. Even though the near term outlook of Bitcoin remain bearish as it still falls below the bullish trend, the upside momentum is supported by the oversold RSI, which is currently at the 30ish mark. Bitcoin needs to climb above $55,000 in order to regain strength. If Bitcoin fails to break through and falls below its support at $46,510, then it will accelerate toward $39,566.
Resistance: 55,103, 58,000, 68,991
Support: 46,530, 39,566, 32,621
EURUSD (4- Hour Chart)

EURUSD trades at fresh weekly lows near 1.1200 region amid tepid EU data. From the technical perspective, the outlook of the pair leans to more sellers’ side on the 4- hour chart as the seller side of the MACD intensifies, reflecting strong selling interest. EURUSD is poised to accelerate its slump toward the next support at 1.1186 after it falls below its moving average. From the RSI indicator, it has not yet reached the oversold territory, providing rooms for further downside. The pair needs to climb all the way above its moving average and the midline of Bollinger Band to regain bullish momentum in the near term.
Resistance: 1.1357, 1.1462, 1.1548
Support: 1.1186
Economic Data
|
Currency
|
Data
|
Time (GMT + 8)
|
Forecast
|
|
USD
|
EIA Short-Term Energy Outlook
|
01:00
|
|
|
JPY
|
GDP (QoQ) (Q3)
|
07:50
|
-0.8%
|
|
INR
|
Interest Rate Decision
|
12:30
|
4%
|
|
EUR
|
ECB President Lagarde Speaks
|
16:15
|
|
|
USD
|
JOLTs Job Openings (Oct)
|
23:00
|
16.369m
|
|
CAD
|
BOC Press Conference
|
23:00
|
|
|
CAD
|
BoC Interest Rate Decision
|
23:00
|
0.25%
|
|
USD
|
Crude Oil Inventories
|
23:00
|
-1.885m
|
|
|
|
|
|
|
|
|
|
|
|
|
|
|
|
|
|
|
|
|


