October 13, 2021
Daily Market Analysis
Market Focus
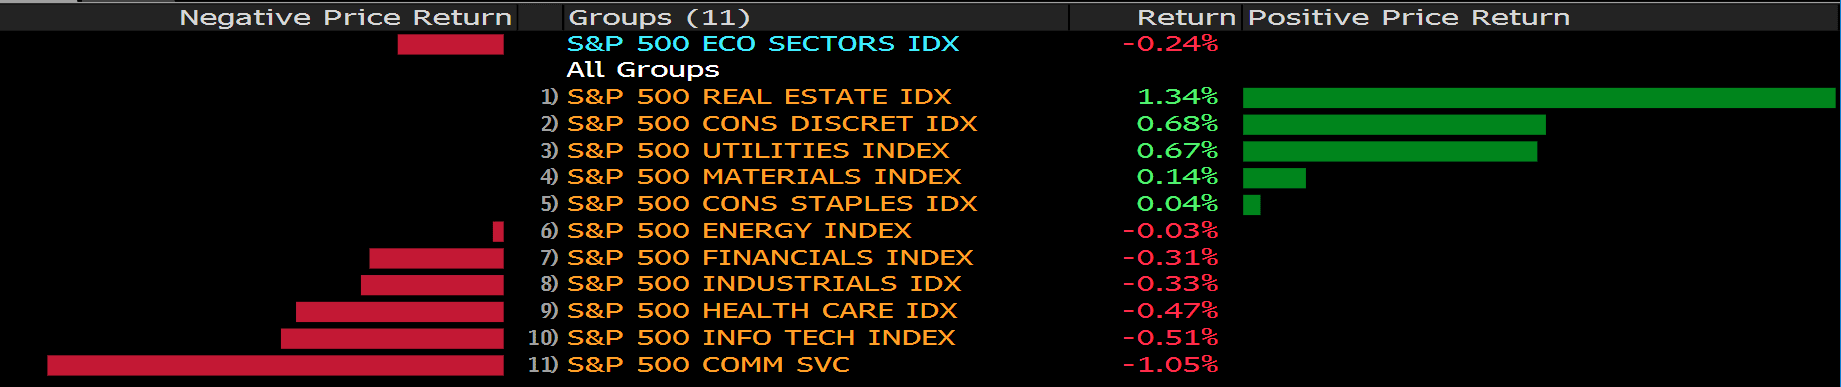
All major U.S. stock indices closed lower for the second straight day. The Dow lost 0.34% to close at 34378.34, the S&P lost 0.24% to close at 4350.65, and the Nasdaq lost 0.14% to close at 14465.93. Poor performance in the communications sector dragged most indices lower, while strong gains in the real estate and consumer discretionary industry helped limit losses. Macroeconomic factors including soaring commodity prices and strong global energy demand put further weight on the threat of inflation.
Oil prices remained at historical heights. The WTI gained 12 cents to settle at $80.64 per barrel, while the Brent Crude lost 23 cents to settle at $83.42 per barrel. Worldwide shortage of natural gas has helped buoy oil prices. On the other hand, the 10-year treasury yield stayed above 1.5%, but the yield experienced its largest one day drop to settle at 1.579%.
This week also signals the beginning of the third quarter earnings season. JPMorgan Chase and Blackrock will be announcing their earnings on the 13th. Speculators are eyeing the performance of the industrial and the materials industry as global demand ticked up and these firms retain better pricing power in the face of rising costs.

Main Pairs Movement:
Another day without high-impact US data leads the risk perception became the primary driver of market movement. With major US indices consolidating in the familiar levels, the US Dollar Index continued its upweard traction and rose 0.15% on Tuesday.
Robust USD strength in the second day of the week forced most of its rival pairs to close in the negative territory. The EUR/USD pair remains within a touching distance of the 15-month low setting at 1.1529 while consolidating its losses. GBP/USD settles around the same old range at 1.3600. USD/JPY advanced to its highest level since late-2018 and seems to have gone into a consolidation phase around 113.50. Commodity-linked currencies posted mild gains against greenback. USD/CAD dropped nearly 0.1%, and AUD/USD climbed about 0.15%.
After surging more than 10% in the previous week, the benchmark 10-year US Treasury bond yield dropped significant 3.6% intraday, fueling gold’s rally. The yellow metal trades at $1760 per ounce at the moment, 0.36% higher than yesterday; Crude oil prices remains unchanged, with WTI’s at $80.50, and Brent at $83.30.
Bitcoin plummeted over 4% after renewing multi-month highs on Monday, now trading at $55,250. Ethereum trades near $3,500 on Tuesday and seems lack of momentum to keep its uptrend, as the overall risk-off mood makes the crypto currencies unattractive.
Technical Analysis:
USD/JPY (4-hour Chart)

The USD/JPY pair refreshed daily lows during the early European session, managed to defend the 113.00 mark, and quickly rebounded thereafter. The pair was last seen hovering around the 113.50-80 region, fresh highs since December 2018.
On the technical front, both the 4-hour MACD histogram and RSI indicator suggest that the USD/JPY pair is strongly bullish, even RSI breaches to the overbought territory, implying the pair might experience a correction in the short term. In our opinion, we think the pair may encounter its first resistance at the upper bound of the Bollinger Band, consolidate awhile, then keep on its uptrend. If not, then the first support for the pair lies on the 4-hour 20 SMA, then 112.00. A breakthrough of the last support 109.15 could open the Pandora’s Box of a downward trajectory.
Resistance: 114.02, 114.55
Support: 112.57, 112.00, 109.15
EURUSD (4-hour Chart)

The EUR/USD pair lingers in the narrow price interval for yet another session on Tuesday. The pair dove to the 2021 low below 1.1530 remains well on the table amid the ongoing bearish trend, at least in the short term. A further retreat from this spot should trigger a relatively quick test of the 1.1500 psychological support, where the March 2020 high sits, and a breakthrough of that will lead the pair to the last barricade ahead of a massive downfall, the June 2020 high at 1.1422.
On the technical front, the 4-hour MACD histogram has just formed a death cross, and the RSI indicator is at 35, strongly bearish but above the oversold territory, suggesting the downward traction should proceed. Moreover, the pair is now deeply below the key 200-DMA line, where the pair should cross to prove a meaningful rebound.
Resistance: 1.161, 1.164, 1.1675, 1.172
Support: 1.153, 1.150, 1.1422
USDCAD (4 Hour Chart)

The USD/CAD pair slides during the New York session is trading at 1.4635, down 0.17% around at nearly market close. The market sentiment is downbeat, portrayed by U.S. stock indices posting losses between 0.25% and 0.34%. Reasons like the energy crunch in Europe and Asia. On oil side, rising oil prices are boosting the loonie, WTI crude oil is barely unchanged at $79.9, outside of $80 per barrel threshold for the first time in two days.
From a technical perspective, RSI indicator still clinging at over sough territory at 38 in nearly two day as market faltering, remain suggesting bearish momentum in short term. On moving average indicator, 15- and 60-long indicator still retaining downside movement.
Since loonie rapidly break through a critical support at 1.25, we expect next downward support will be last July low at 1.2425. On up side, psychological level at 1.25 will turn into a pivotal resistance for short-term, 1.256 behind.
Resistance: 1.25, 1.256
Support: 1.2425, 1.23
Economic Data
|
Currency
|
Data
|
Time (GMT + 8)
|
Forecast
|
|
GBP
|
GDP (YoY, MoM)
|
14:00
|
–
|
|
GBP
|
Manufacturing Production (MoM)(Aug)
|
14:00
|
0.1%
|
|
GBP
|
Monthly GDP 3M/3M Change
|
14:00
|
–
|
|
USD
|
Core CPI (MoM)(Sep)
|
20:30
|
0.2%
|
|
USD
|
FOMC Meeting Minutes
|
02:00 (10/14)
|
–
|
|
|
|
|
|
|
|
|
|
|
|
|
|
|
|
|
|
|
|
|
|
|
|
|
|
|
|
|
|
|
|
|


