April 1, 2021
Daily Market Analysis
Market Focus
Technology shares led U.S. stocks higher, regaining favor on the last day of a quarter where they trailed the rest of the major market sectors, with President Joe Biden set to unveil his next stimulus plan.
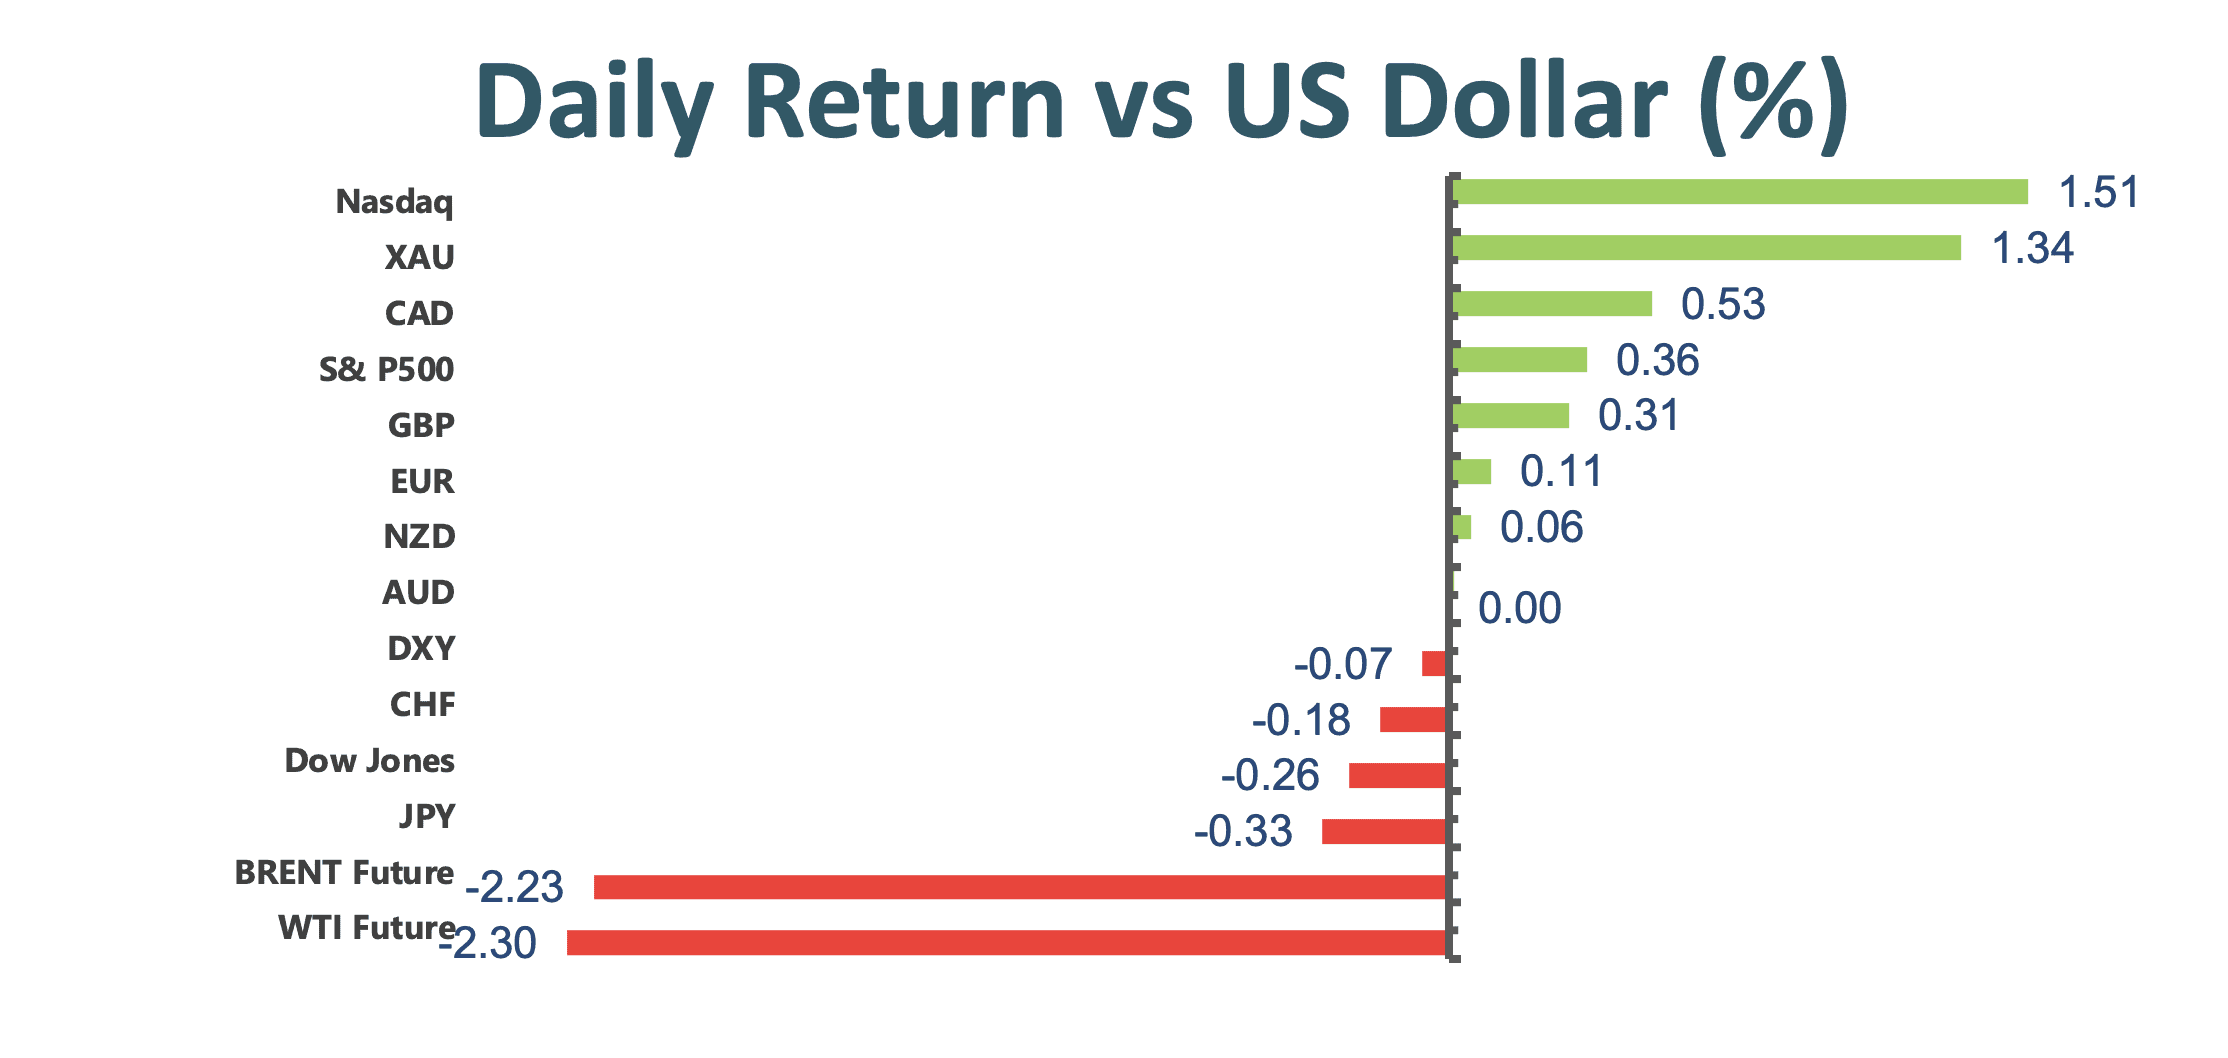
Apple Inc., Microsoft Corp. and Tesla Inc. pushed the tech-heavy Nasdaq 100 up 1.5%, while the Dow Jones Industrial finished lower with investors favoring growth over value shares again. The benchmark S&P 500 set an intra-day high, retreating from a record closing level in the last moments of trading.
Data for March showed U.S. private employers added the most jobs in six months, adding to evidence that the vaccine drive and business reopening are encouraging hiring. On the other hands, however, market shrugged off the worst-than-expectation data of pending home sales which record 10.6 contraction.
Investors, rattled this week by the meltdown at Bill Hwang’s Archegos Capital Management, are turning their attention to growth and inflation as volatility spurred by the forced sales subsides. While Europe’s struggle with inoculations and the resurgence of the coronavirus have tempered growth expectations, the U.S. vaccine rollout is surpassing targets.

Market Wrap
Main Pairs Movement
Oil fell after an OPEC+ panel meeting ended without an oil policy recommendation. The dollar weakened, but still posted its best quarter in a year. The Bloomberg Commodity Index and developing-nation currencies climbed.
The dollar index retreat from daily peak once approached nearly 6 months high then close at fell 0.12%. Moreover, the dollar declined against most G-10 peers, paring its biggest quarterly advance in a year as President Joe Biden unveiling his 2.25 trillion investment plans.
Loonie is down 0.5% to 1.2574 after falling as much as 0.7%, the hardest since March 11. Haven currencies faltered Wednesday, capping a quarter when rising U.S. Treasury yields created support for the dollar.
Technical Analysis:
EURUSD (4 hour Chart)

Euro dollar has quell nearly upwind movement then turn north way intraday amid weakness dollar as investor are stay tune for President Joe Biden’s infrustruction investment plan, however, market did not keep win while dragged down in nearly market close. On 4-hour chart, we see that euro dollar did not bounced back to our vital resistance point today that given a fragile spot from our perspective. At the mean time, both 15 and 60-long SMAs clinging it downward trend. On the other hands, RSI indicator set at 41 figure that suggest a slightly bearish momemtum for short-term.
Therefore, we do not prospect for pick up way as aforementional. For south way, daily low, 1.17, will go down as a frail but important support as it lack of price cluster below. Since, once euro dollar is going to tamp down further this support level then market could foresee another plummet ahead.
Resistance: 1.1765, 1.18, 1.1835
Support: 1.17
USDJPY (4 hour Chart)

USDJPY continues to perform its bullish momentum, currently trading at 110.73 which once hit 111, the one-year high level. For market side, Japanese yen extend it torrid devalution momentum which become unglglued since this year. We believe that carry trade behavior prompt this rally branza align with unstopable U.S. share market boost.
For technical perspective, 15 and 60-long SMAs have an edge over in pick up way that retain it impetus. On RSI side, indicator slipped from overwhelming over sought area to 69 figure, still suggesting a bullish guidline for short term.
Therefore, combing the terms above, we foresee yen market will still remaining it upward position. But only one concernig spot currently, yen has gained extraordinary reward since this year, so posiblity of keep picking up, we believe it will be a small-probability event.
Resistance: 110.85, 111.00
Support: 110.35, 109.8, 109.45
XAUUSD (Daily Chart)

Gold was rising more than 1% on Wednesday, recovering after posting sharp losses during two continous days, despite a modest rallied in U.S. yield, a correction of the U.S. dollar, month-end flow, and some profit-taking favored the rebound, according to traders. Gold recover further above $1700 to $1707.7 at market close, still under the downward resistance on it head. RSI indicator was recognized 49.7 figures, which still in lightly bearish backdrop. In addition, 15 and 60-long SMAs constantly on exacerbated way.
In the lights of points above, we expect gold market will under pressure as downward resistance and unfavorable indicator guidianc. On the slid side, phycological level at 1700 still a vital first pivot support, if stall, then eye-capture on 1678.85. However, once market go north way, first resistance will be 1722.75 which oodles price cluster place.
Resistance: 1722.75, 1738.32, 1754.53
Support: 1700, 1678.85
Economic Data
|
Currency
|
Data
|
Time (GMT + 8)
|
Forecast
|
|
JPY
|
Tankan Large Manufacturing Index (Q1)
|
07:50
|
-15
|
|
JPY
|
Tankan Large None-Manufacturing Index (Q1)
|
07:50
|
-5
|
|
AUD
|
Retail Sales (MoM)(Feb)
|
08:30
|
-1.1%
|
|
CNY
|
Caixin Manufacturing PMI (Mar)
|
09:45
|
51.3
|
|
USD
|
ISM Manufacturing PMI (Mar)
|
22:00
|
61.3
|
|
|
|
|
|
|
|
|
|
|
|
|
|
|
|
|
|
|
|
|
|
|
|
|
|
|
|
|
|
|
|
|


