March 31, 2021
Daily Market Analysis
Market Focus
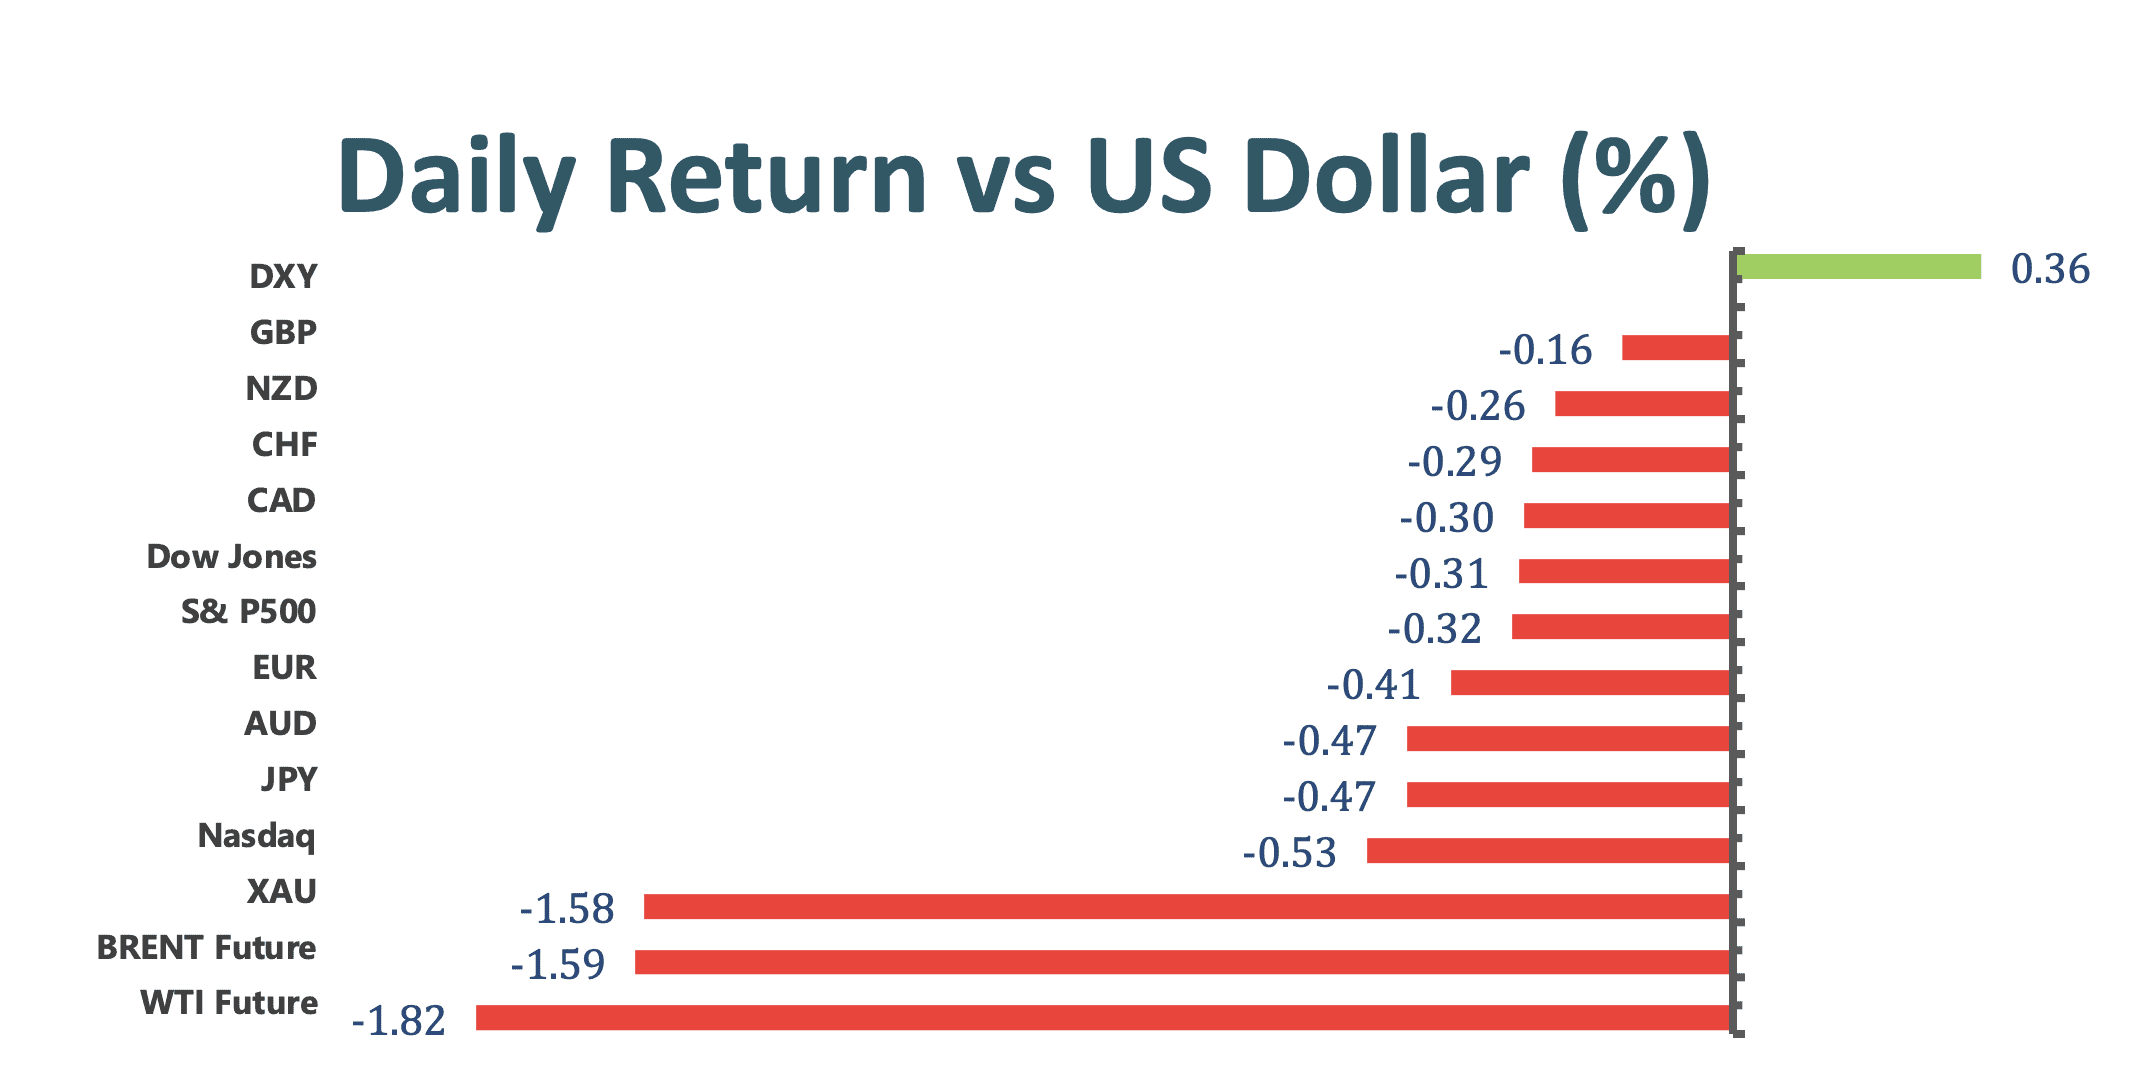
US stocks declined for a second day as the US Treasury yields hit a 14-month high as investors weighed the consequences of the stimulus check, potentially resulting in higher inflation. The 10-year Treasury yield climbed as vaccine rollouts and expected Joe Biden’s infrastructure spending boosted expectations of a broad economic recovery and rising inflation. The Dow Jones Industrial Average dropped 104.41 points, slipping from a record closing high; S&P 500 slid 0.3% while the Nasdaq dropped 0.57%.
Overview of President Joe Biden’s plan:
–$650 billion to rebuild the United States’ infrastructure.
–$400 billion toward care for elderly and the disabled people.
–$300 billion for housing infrastructure.
–$300 billion to revive US manufacturing.
Banks roiled by the Archegos Capital fallout might see total losses in the range of 5 million to 10 billion. Markets are trying to find out the final losses to banks exposed to the Archegos implosion. It is hard to estimate the total losses according to JP Morgan due to the nature of the leveraged trading involved.

Market Wrap
Main Pairs Movement
Gold continued to decline, approaching a nine- month low amid the vaccine rollouts and the rise of US bond yields. As the US bond yields rose, weighed on the outlook for growth and inflation, the non- interest- bearing Gold got pushed below $1700 level, currently trading at $1683. Moreover, the fast pace of the global economic recovery has essentially reduced the haven appeal of the metal; at the same time, a selloff in ETFs backed by gold was further eroding the support.

The dollar index hit near the highest level since last year, rising about 0.35% on a daily basis, as the US Treasury yields elevated, and stocks declined over Joe Biden’s fiscal policy. Moreover, adding to the bullish side of the dollar index, the optimistic view about the overall economy from New York Federal Reserve President also lends support the dollar index.

The Canadian dollar declined as a gauge of the US dollar climbed to the highest since last year, boosted by rising yields. The Canadian dollar also fell along with the oil price. Oil price fell along with the broader commodity complex ahead of an OPEC+ meeting.
Technical Analysis:
EURUSD (Daily Chart)

EURUSD extends its fall, tumbling toward 1.17, the lowest since November. On the daily chart, EURUSD has broken the descending trend, accelerating the downside pressure toward the next support at 1.1695. Moreover, with the RSI currently at 31, still having rooms to extend further south. The pair keeps falling below bearish moving averagesm with the 20 SMA capping advances around 1.1895. On the upside, EURUSD’s bearish momentum might potentially confront a pause or a pullback around the support at 1.1695 as the level is considered as solid and strong, not yet been touched since Octorber.
Resistance: 1.1945, 1.2349
Support: 1.1695, 1.1492, 1.1290
USDJPY (Daily Chart)

USDJPY continues to perform its bullish momentum, currently trading at 110.27. USDJPY prolongs its recent upward trajectory and reaches multi- month highs today. On the daily chart, the pair continues to trade within the ascending channel and outplayingly above the 50 SMA, confirming a fresh bullish momentum toward the next resistance at 111.40. Nonetheless, the bullish momentum might be pause as the RSI on the daily chart is currently overbought, 79; USDJPY buyers might sense some caution before positioning for any further positive move.
Resistance: 111.40, 114.55
Support: 109.45, 107.87, 106.29
XAUUSD (Daily Chart)

Gold adds to the previous day’s losses and witnessed some follow- through selling for the second consecutive day today, trading at 1685.44. With the downside pressure, it appears to form a rounded top, signaling the end of an uptrend and the possible start of a downtrend. It is expected to see gold heading to further south, testing the support level of 1676.89 as the MACD indicator signals potentially a momentum change, bullish- to- bearish. Moreover, the RSI is still outside of the oversold conditions, implying a further falls in the next few trading sessions.
Resistance: 1746.91, 1790.23, 1825.24
Support: 1676.89
Economic Data
|
Currency
|
Data
|
Time (GMT + 8)
|
Forecast
|
|
CNY
|
Manufacturing PMI (Mar)
|
09:00
|
51
|
|
GBP
|
GDP (QoQ) (Q4)
|
14:00
|
1.0%
|
|
GBP
|
GDP (YoY) (Q4)
|
14:00
|
-7.8%
|
|
EUR
|
German Unemployment Change (Mar)
|
15:55
|
-3 k
|
|
EUR
|
CPI (YoY) (Mar)
|
17:00
|
1.3%
|
|
USD
|
ADP Nonfarm Employment Change (Mar)
|
20:15
|
550 k
|
|
CAD
|
GDP (MoM) (Jan)
|
20:30
|
0.5%
|
|
USD
|
Pending Home Sales (MoM) (Feb)
|
22:00
|
-2.9%
|
|
|
|
|
|
USD
|
Crude Oil Inventories
|
22:30
|
0.107 m
|
|
|
|
|
|
|
|
|
|
|
|
|


