March 9, 2021
Daily Market Analysis
Market Focus
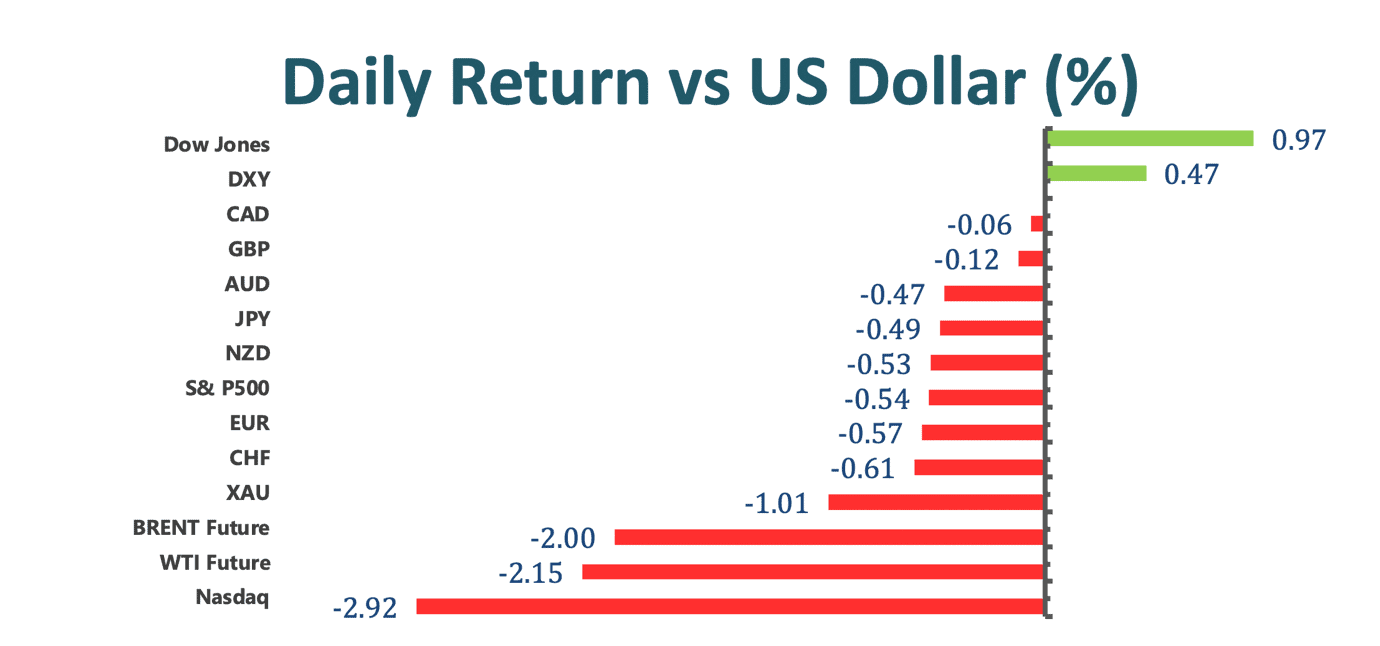
US stocks were mixed as the Dow Jones Industrial Index made record high of 32,117 whilst the Nasdaq 100 index plunged 2.16% on Monday. It seems like investors were taking a breather from technology stocks and fled into cyclical stocks. Materials and Industrials stocks were leading the gains in the S&P 500, and tech section was the only one left behind.

President Joe Biden’s $1.9 trillion stimulus is poised to reach the House after passing the Senate on Saturday. A vote will be held on Tuesday on the so-called American Rescue Plan Act. Economists have boosted forecasts for growth thanks to the long-eyed stimulus package, along with recent evidence that the economy is already picking up pace. Democrats expect Biden to sign his first victory bill by March 14.
Key highlights of National People’s Congress from China Macro Economy:
• In 2021, China aims to achieve GDP growth target of “above 6 percent”.
• Will increase lending by big banks to small businesses by more than 30 percent this year, and continue fintech clamp down.
• Sets comprehensive plan to become advanced manufacturing powerhouse.
• Will be vigilance on Covid-19, and may not open border until 2022.
Market Wrap

Main Pairs Movement
The US greenback appreciated against all of its G-7 peers, and the dollar tracking index gained 0.41%, settled around 92.35. Higher treasury yield continue to eke out the dollar as media was revealing banks are shorting bonds in the long end of the yield curve. Yahoo.com reported that the US 10-year repo rate was at -0.5% last Friday, implying banks are forgiving and even paying interest to lend money in order to collect borrower’s collateral, which in this case are US treasury bonds. This might explain the recent disconnection between equity and bond market, the Down Jones Industrial index is making record new highs while the 10-year yield spiked beyond 1.6%. The yield rate itself has lost track of its conventional purpose; the distorted interest rate is temporarily not acting as a benchmark for valuing stocks.
Cable held considerably well against the US dollar despite dipping 0.14% on Monday. BoE Governor Andrew Bailey continue to fuel optimism on the Sterling, saying the outlook is positive but with large doses of cautionary realism, and expects inflation to rise in the short term.
Safe-haven currencies continues to underperform against the greenback, both Japanese Yen and Swiss Franc suffered their largest weekly losing streak since last March, depreciated 3.73% and 4.88% in the past four weeks.
Gold is probing lower to sub $1680 level, threatened to breach below last June’s key support line. It would be tempting for big players to dive price below $1670 to take out all these stop-loss levels layered beneath prior to releasing the subdued precious metal back to normal levels.
Technical Analysis:
XAUUSD (Daily Chart)

Gold is falling onto a support zone between $1691 and $1674, where the bears failed to overcome back in last June. It is also close to kissing the ascending trendline started from May 2019. Given the recent strong bearish run, the relative strength index is signaling oversold in the daily chart. It seems like now is good chance for the bulls to stage a decent rebound at these support levels, and the red downward trendline should be a modest ceiling for the recovery if prices are willing to bounce at all. On the downside, selling momentum could accelerate after breaching the support zone, and possibily eyes for $1600 handle.
Resistance: 1765, 1823
Support: 1691-1674, 1600
EURUSD (Daily Chart)

Euro dollar is extending its bearish run for a four-consecutive day, erasing nearly 2% of this year’s gain, and settle around 1.1855. The overall bullish bias since last June has ended as price plunged blow 1.19 without much hesitation, indicating pressure on the shared currency remain rebust. That being said, the bears would take a break once hiting November low of 1.178. RSI is on the edge of oversold zone, but will likely to travel a bit further south on the daily chart. Movement in this pair is somewhat puzzled as investors are trying to figure out what is happening in the backdrop, most are giving rallying US yield the credit for strong greenback.
Resistance: 1.193, 1.221
Support: 1.178, 1.163
GBPUSD (Daily Chart)

Cable struggled to find solid demand amid strengthening US greenback, but it managed to put up some resilient defense line. The overvalued Sterling couldn’t resist gravity, and was dragged down shortly after peaking 1.416. The pair closed with a long lower wick last Friday, indicating previous support at 1.38 handle is indeed valid in the short run. In confluence with DMA50 provide sound reasons to stop further selling momentum. However, MACD on the daily chart is still favoring a bearish trend, and we don’t expect a bullish reversal unless seeing weakened MACD bears.
Resistance: 1.416, 1.43
Support: 1.38. 1.352
Economic Data
|
Currency
|
Data
|
Time (TP)
|
Forecast
|
|
JPY
|
GDP (QoQ) (Q4)
|
07:50
|
3.0%
|
|
OIL
|
EIA Short-Term Energy Outlook
|
20:00
|
|
| |
|
|
|
| |
|
|
|
| |
|
|
|
| |
|
|
|
| |
|
|
|
| |
|
|
|
|
|
|
|
| |
|
|
|
|
|
|
|
| |
|
|
|
|
|
|
|


