March 1, 2021
Daily Market Analysis
Market Focus
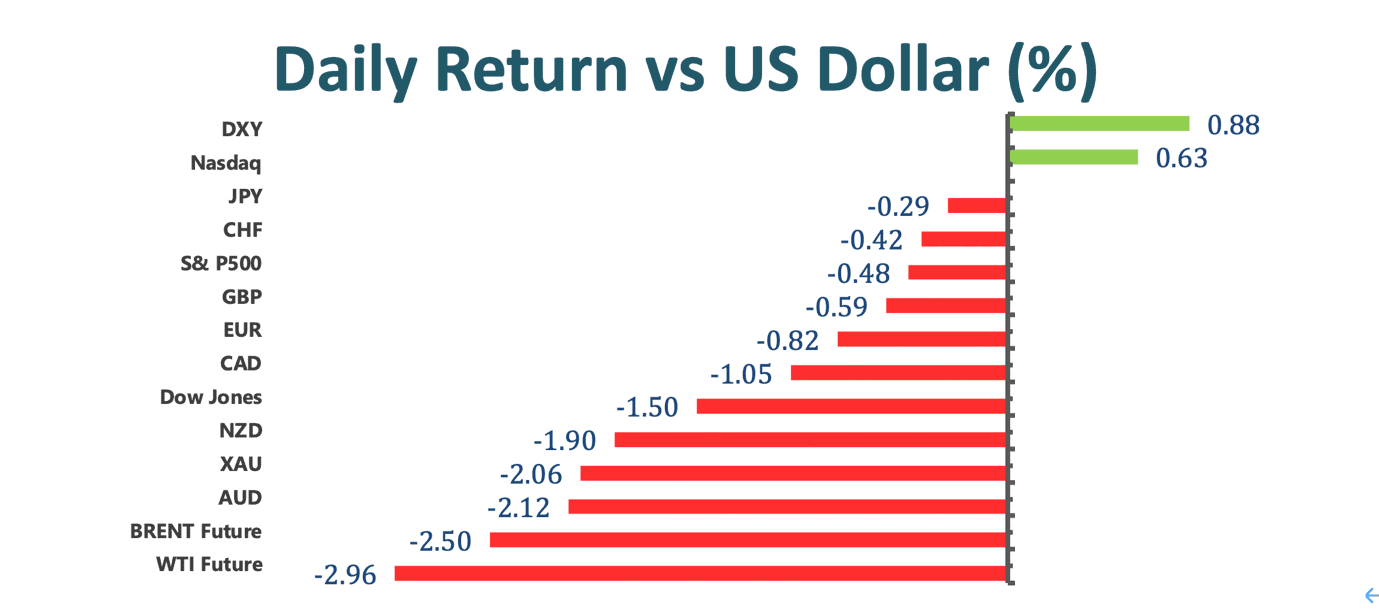
US tech stocks staged a modest rebounded on the last day of a tumultuous week as a global bond rout eased, sending the yield on 10-year Treasuries tumbling below 1.5%. Gains for Microsoft Corp. and Amazon.com Inc. helped lift the Nasdaq 100 about 0.6%. Energy producers and banks were among the worst performers, dragging down the Dow Jones Industrial Average. The dollar jumped for a second day, helping fuel a slump in commodities from oil to gold to copper.
Investors are getting increasingly worried that accelerating inflation could trigger a pullback in monetary policy support that has fueled gains in risk assets amid the pandemic. Fed Jerome Powell says higher Treasury yields reflect optimism on the outlook for growth and officials have stressed that the central bank has no plans to tighten policy given lingering weakness in the labor market.

Asian shares tumbled in line with Thursday’s rout in the U.S., and European gauges also closed lower. Global bonds stabilizes after central banks from Asia to Europe moved to calm a panic that had sent U.S. government bond yields to their highest level in a year and spurred a selloff in stock market.
The Nas 100 pared its weekly loss to about 5%, still the worst since Oct, amid concern that valuations for tech stocks that soared during the pandemic have gotten out of hand. Elsewhere, copper slid the most in four months, falling from a nine-year high. Gold fell to the lowest since June.
Market Wrap
Main Pairs Movement
EURUSD has extended its falls and struggles around 1.21 as the risk-off mood and elevated US bond yields favor the dollar. President Biden’s stimulus bill ran into a snag. The Fed’s preferred inflation measure and end-of-month flows are eyed.
GBPUSD has fallen sharply, trading below 1.39 and down some 350 pips from the highs. The USD picks up bids as the bond market rout seems to resume. BoE Governor Bailey expects a negative first quarter for the economy.
Soaring US Treasury yields and falling equities keep leading currencies. Japanese data came in slightly better than expected, indicated slowing economic progress. USDJPY is technically bullish near fresh 2021 highs.
DXY keeps the bid tone unchanged above 90.75 on Friday. A buoyant US dollar is weighing on USD priced crude oil markets on the final trading day of the week. WTI has slipped more than $1.0 and back into the low $62.00.
Technical Analysis:
USDCAD (Four-hour Chart)

The Loonie builds on its previous day’s positive notion and advances towards the 1.2717 resistance level at the time of writing. The rally in USDCAD is still largely supported by the growing risk aversion sentiment and rising US yields. The DXY has now surpassed the 90.85 threshold. From a technical perspective, the two-day winning streak of the Loonie is supported by the MACD histogram. However, with a close-to-70 RSI, the upward trend of the pair might not be sustainable for too long. If the Loonie can consolidate above the 1.2717 price level, the following resistance can be seen around 1.2755, then 1.28. Conversely, if the Loonie loses positive traction, the most immediate cushion can be found at 1.2634, 1.2619, and 1.2567.
Resistance: 1.2717, 1.2755, 1.28
Support: 1.2634, 1.2619, 1.2567
AUDUSD (Four-hour Chart)

Coming under the bearish pressure on Thursday, the Aussie pair first attempted to stay above the 0.78 price level; however, during the late Europe trading session, a renewed bearish pressure collapsed and dragged Aussie toward the low 0.77s. The pair has lost more than 100 pips on the day as the greenback continues to gather strength ahead of the weekend. Technically speaking, a positive correction is likely in the near future as the RSI is now fluctuating below 30. Although the recent plummet of the pair is not supported by the 15-Day SMAVG, the drastic sell-off on the pair is reflected significantly on the MACD histogram. Now testing the critical 0.77 support at the moment, a break below would easily further extend the Aussie’s bearish momentum.
Resistance: 0.7734, 0.7788, 0.7872
Support: 0.7703, 0.7675, 0.7633
XAUUSD (Four-hour Chart)

While the risk-off sentiment dominates the markets, the safe-haven pair – XAUUSD, has yet to gain any positive traction for the second straight day. In contrast, the elevated US bond yields continued to support the market’s demands and strengthened the DXY. On the last day of the week, XAUUSD has dipped more than $50 dollars, erasing more than 2.5% of the Gold’s value. From a technical perspective, the 60-Day SMAVG is supporting the XAUUSD bearish momentum. However, given that the RSI has now reached the 23s, it is reasonable to see a reverse in the trend. In the bigger picture, given that the markets are mostly turning their heads toward an overall rebound across the global economy, the demand for Gold is likely to grow; as a result, it would not be a surprise to see the precious metal to dip lower in the foreseeable future.
Resistance: 1766, 1779, 1804
Support: 1715, 1708, 1683
Economic Data
|
Currency
|
Data
|
Time (TP)
|
Forecast
|
|
CNY
|
Caixin Manufacturing PMI (Feb)
|
09.45
|
51.5
|
|
EUR
|
German Manufacturing PMI (Feb)
|
16.55
|
60.6
|
|
GBP
|
Manufacturing PMI (Feb)
|
17.30
|
54.9
|
|
USD
|
ISM Manufacturing PMI (Feb)
|
23.00
|
58.9
|
|
|
|
|
|
|
|
|
|
|
|
|
|
|
|
|
|
|
|
|
|
|
|
|
|
|
|
|
|
|
|
|
|
|
|
|


