On Friday, US equities were mixed, with large technology companies posting the worst performance, while energy companies posted the best gains. Market participants are now closely monitoring the US Federal Reserve’s next moves. The S&P 500 finished roughly 0.3 percent lower after attempting a comeback to snap a three-week winning streak, while the Dow recovered from earlier losses to climb 140 points, or 0.4 percent, higher. The Nasdaq Composite Index fell 1.3 percent as underperformance in technology stocks kept the index in the red for the duration of the session.
Loretta Mester, chair of the Cleveland Fed, expressed confidence that the United States will avoid recession as the Federal Reserve tightens policy, though inflation will likely remain above 2% into next year. “I believe that bringing inflation down will take some time,” Mester said on CBS’s “Face the Nation,” referring to rising energy and commodity prices. “Thus, I believe inflation will remain above 2% this year and even next year, but on a downward trajectory.”
China’s efforts to eradicate Covid-19 also contribute, Mester, stated. “Certainly, the Chinese lockdown will exacerbate the supply chain problems we already have,” she said. “As a result, prices are being pushed upward.”
Fed officials increased interest rates by a quarter-point last month to a target range of 0.25 percent to 0.5 percent and indicated they expect rates to reach 1.9 percent by the end of 2022 and 2.8 percent by the end of next year, according to their median forecast.
Main Pairs Movement
In an otherwise calm week of data, Wednesday’s release of the FOMC minutes stirred things up as they showed committee members agreeing that elevated inflation and the tight labor market warrant balance sheet reduction start soon. With more certainty that the Fed will embark on a faster wind-down this cycle, the yield curve generally steepened, notably with the 2s/10s spread turning positive.
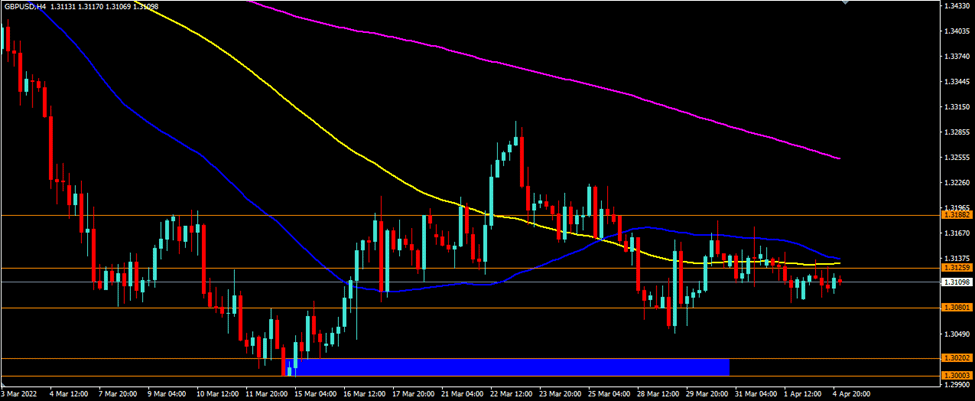
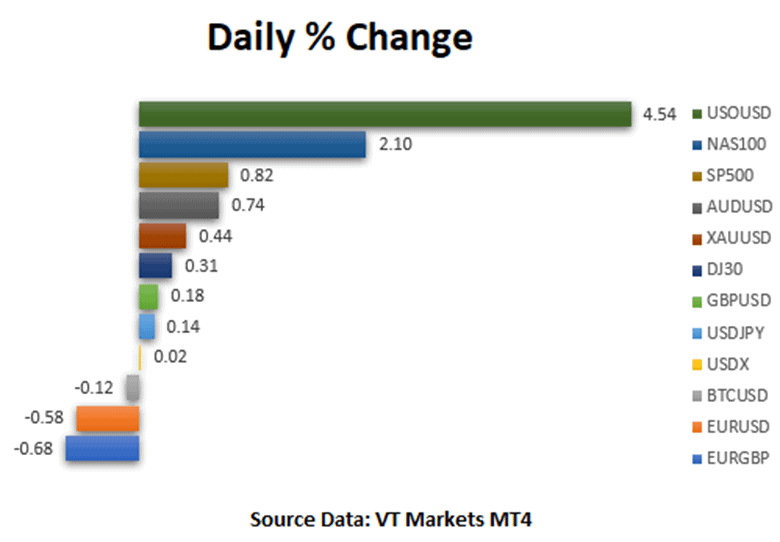
Greenback outperformed all its major rivals last week. The EUR/USD pair closed the week 1.50% lower at 1.0877, while GBP/USD was down 0.68% at the same period of time, last seen at 1.3025. The Japanese Yen depreciated by 1.49%, at 124.34 against the US dollar, while its Chinese peer stayed sidelined in value. Commodity-linked currencies were also limped during last week’s trading, with USD/CAD up 0.40% to 1.2572, and AUD/USD down 0.51% to 0.7458. As to commodities, Gold climbed 1.18% to $1,947.68 a troy ounce, while crude oils closed the week in the red, with WTI closing lower by 1.61% at $97.76, and Brent at $102.32, down 1.99%.
Technical Analysis
AUDUSD (4- Hour Chart)
AUDUSD holds lower ground below the 0.7500 level despite upbeat RBA FSR as the US dollar index advances to 100 for the first time in almost two years, boosted by the prospect of a more hawkish Federal Reserve. From the technical perspective, the overnight strong move down validated a near-term bearish breakout through the support level at 0.7471. The downward break-through triggers bearish traders. At the time of writing, the next immediate support at 0.7432 seems to hold the defensive land; failure to defend 0.7432 will accelerate the downside momentum toward the psychological support at 0.7300. From the RSI indicator, the reading continues to hover within the negative territory; at the same time, a negative MACD shows that AUDUSD is in the negative stance on the four-hour chart.
USDCAD edges lower, intending on testing its support level at 1.2600, with the latest decent Canadian employment figures. From the technical aspect, the four-hour outlook of USDCAD looks neutral at the time of writing, since the currency pair is hovering around the support level. The acceptance above 1.2600 would attract more buying interests, boosting USDCAD further north toward the next hurdle at 1.2700. On the flip side, failure to defend the 1.2600 level would support USDCAD’s bearish stance. Looking ahead, more dynamic fluctuations will be expected to happen next week as the US is going to release some key tier data.
Resistance: 1.2700 Support: 1.2600, 1.2463
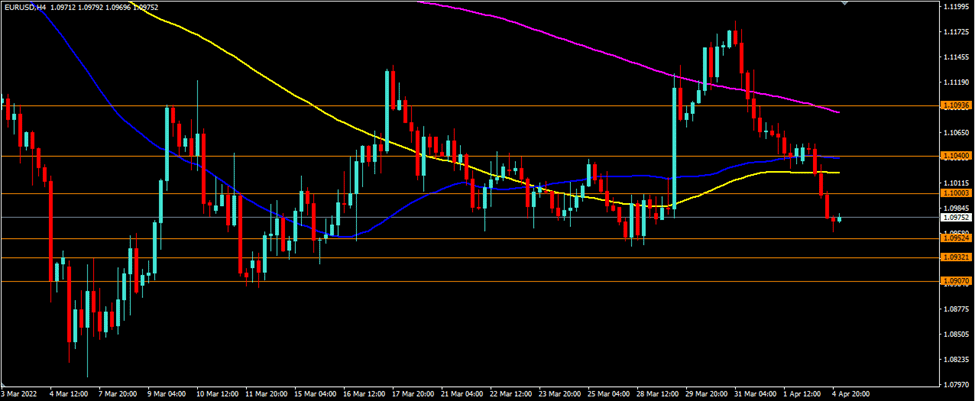
EURUSD (4- Hour Chart)
EURUSD dropped on Friday amid the strong demand for the US dollar. From the technical perspective, the outlook of the EURUSD continues to align with the bearish stance, trading within the descending trend line since late March. On the four-hour chart, the RSI stays nearly 35, having a difficult time making a steady upward correction. In the meantime, the MACD continues to fall heavily in the negative territory, suggesting a bearish outlook for EURUSD. If the US dollar keeps up its strong demand, then EURUSD is looking to challenge the next immediate resistance at 1.0806.