January 19, 2022
Market Focus
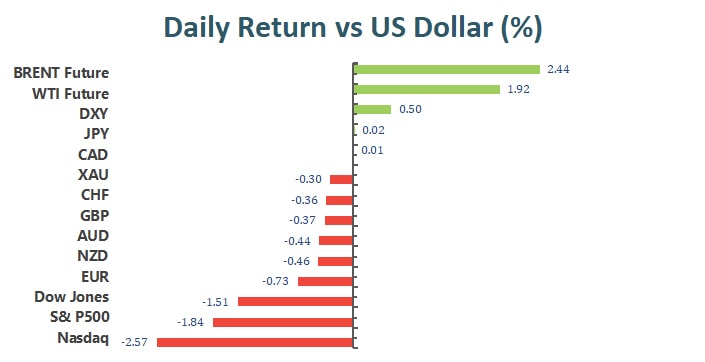
Wall Street’s main indexes fell sharply on Tuesday as soaring U.S. Treasury yields hit tech stocks in the U.S. and Europe, while losses at Goldman Sachs led to losses in U.S. financial stocks. U.S. 10-year yields now rose to a two-year high of 1.875%, while two-year yields also rose above 1%, as traders braced for the Federal Reserve to be more aggressive in tackling unabated inflation. At the end of the market, the Dow Jones Industrial Average slid 1.51% to 35,368.47 points, the S&P 500 index lost 1.84% to 4,577.11 and the Nasdaq Composite Index, slipped 2.6% to 14,506.9 points. On the other hand, European tech stocks were also under pressure and fell 2.2%, causing the pan-European STOXX 600 index to drop as much as 1.44% during the session before closing down 0.97%.

Of the 11 sectors in the S&P 500, 10 ended lower, information technology was the biggest loser, down 2.48%, followed by interest-rate-sensitive financials, down 2.27%. Energy, the biggest gainer so far in 2022, was the only sector in positive territory, up 0.4%. Large-cap stocks such as Microsoft, Apple and Meta fell 2.43%, 1.89% and 4.14% respectively, weighing on the information technology sector. In addition, the worst performance of the Dow Jones index was Goldman Sachs Group, which fell 6.97%, JPMorgan Chase fell 4.19%, and Cisco Systems fell 2.66%. The worst performers on the S&P 500 were Moderna Inc, down 8.85%, Applied Materials, down 8.77%, and KLA-Tencor Corporation, down 7.20%.

Main Pairs Movement:
The U.S. dollar is the overall winner compared to all its major competitors. U.S. Treasury yields surged to the milestones, with the 10-year yield at 1.856% and the 2-year yield over 1%. Stocks edged lower and global indices closed lower.
As Treasury yields continued to rise, the dollar was fueled. The Dollar Index moved on its winning streak, gaining 0.5% to end at 95.7.
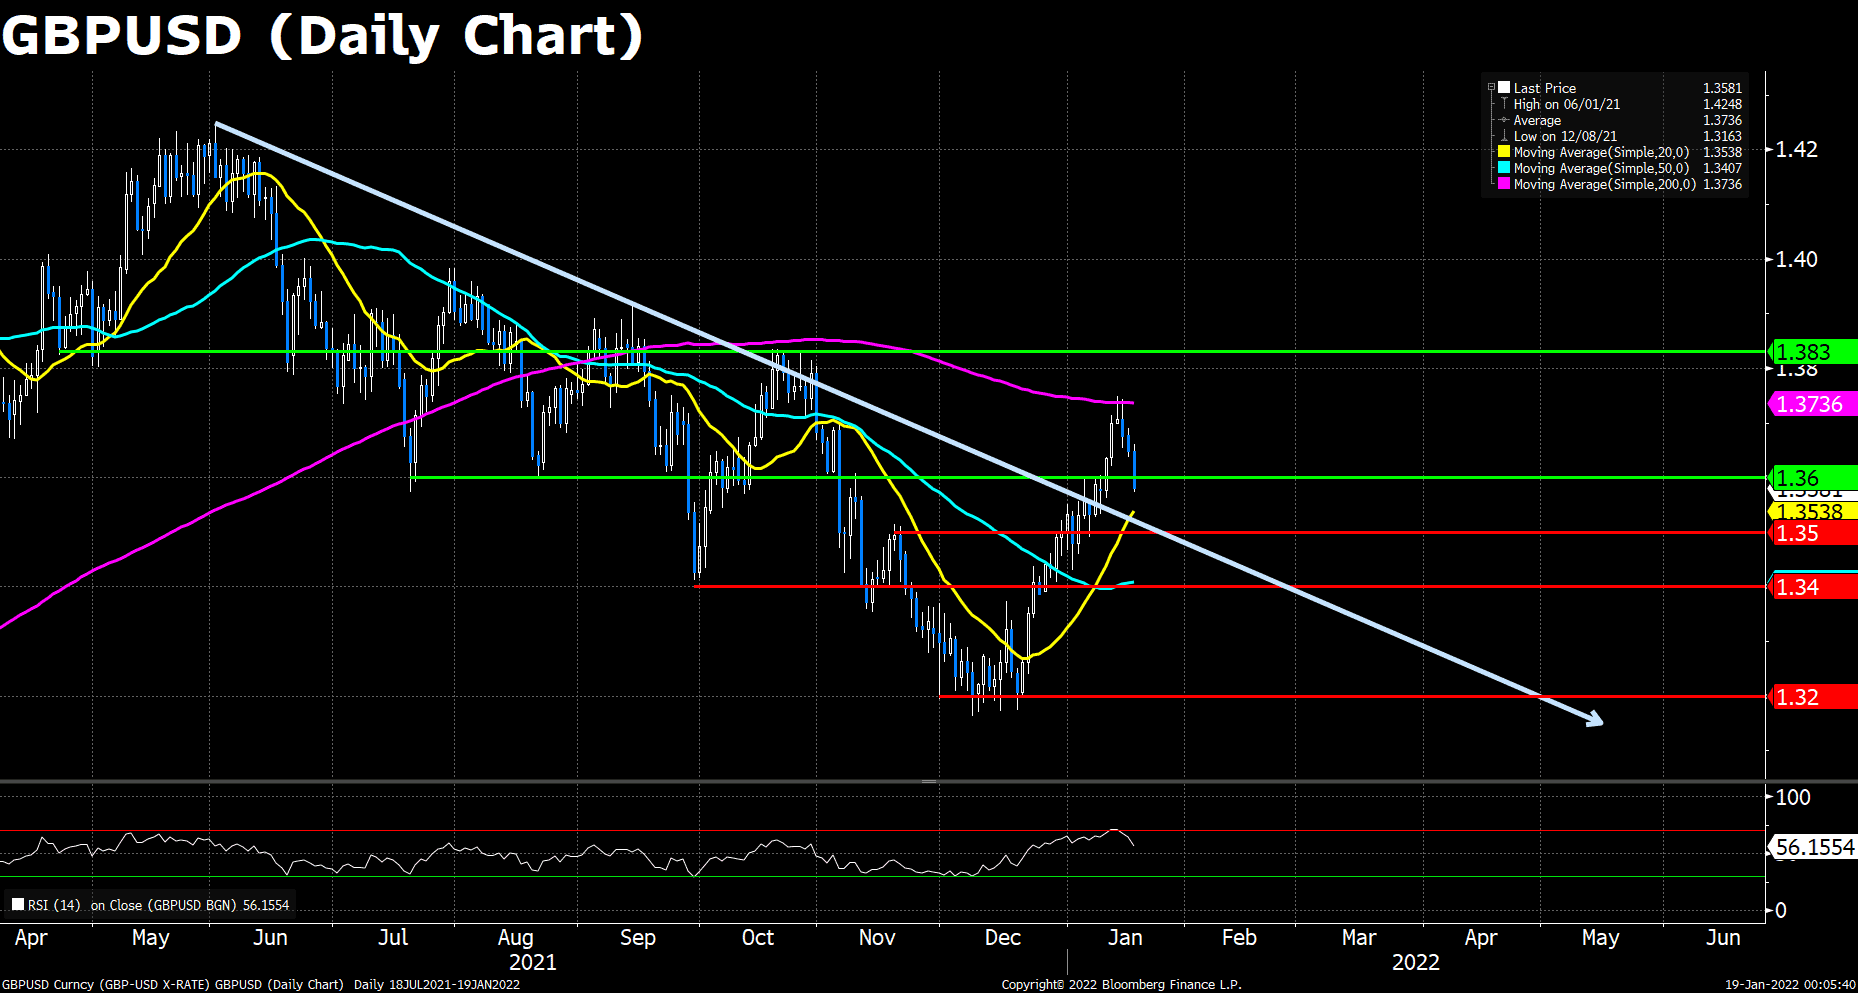
Cable started to fall and dipped below 1.3600. The unemployment rate fell to 4.1% in the three months to November, while the number of unemployed fell by 43.3K in December. Meanwhile, a scandal over Downing Street parties has put Prime Minister Boris Johnson’s leadership at risk during Britain’s worst lockdown.
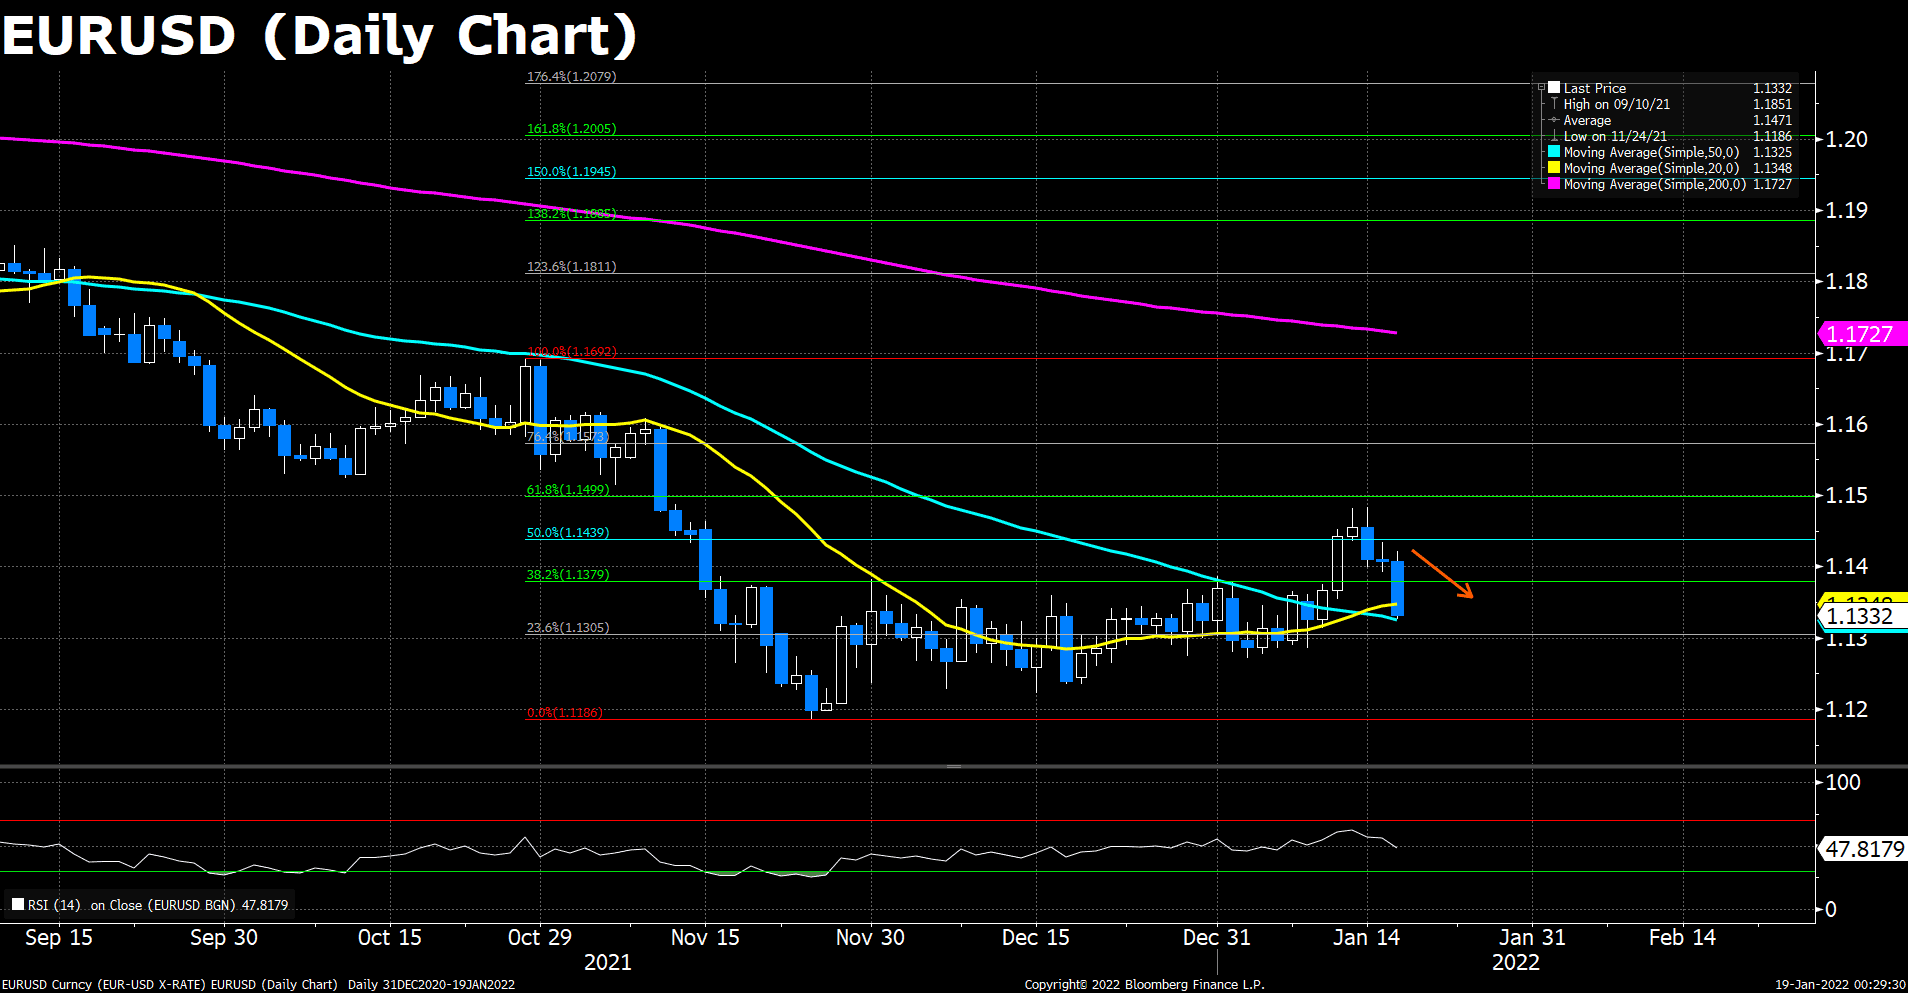
The same pattern scenario for EUR/USD, after reaching the 1.14500 level, the pair declined and is currently back in the consolidation zone. Despite Germany’s ZEW survey showing a sharp rebound in economic sentiment, it offered little help.
Technical Analysis:
GBPUSD (Daily Chart)

Cable headed to the south for the third consecutive day as the hawkish Fed rate hike timetable has been finally in effect. The GBP/USD pair traded sidelined during the Asian Pacific session, but then plummeted at the beginning of the European trading hours, and dropped further after the Wall Street opening as the US equities opened low. That’s said, the tightened US policies and the risk-off market mood boosted the greenback.
On the technical front, the RSI indicator reads 56.23 as of writing, retreated from yesterday’s 60s, suggesting a depletion in the bulls’ strength. Moreover, Cable has made several attempts to regain 1.3600 intraday but failed, indicating that a strong selling power is hovering around that critical resistance level, and making the pair’s comeback more difficult.
Resistance: 1.3600, 1.3736 (200 DMA), 1.3830
Support: 1.3500, 1.3400, 1.3200
EURUSD (Daily Chart)

The Euro pair’s price actions are similar to Cable ones, but as the ECB is more conservative in monetary policies, the shared currency is more vulnerable to unfavorable circumstances, such as the recent US dollar rally and equity crashes. The pair now hovers around 1.1330, seventy pips down during today’s trading with the negative tone intact.
As to technical, if the EUR/USD pair fails to recover over 38.2% Fibonacci, then it could remain under pressure, looking at the 1.1300 zone and then season lows around the 1.1200 support. The slide pushed the pair back below all its major moving averages and into the previous consolidation phase in December 2021.
Resistance: 1.1380, 1.1440,1.1500
Support: 1.1300, 1.1200
USDCAD (Daily Chart)

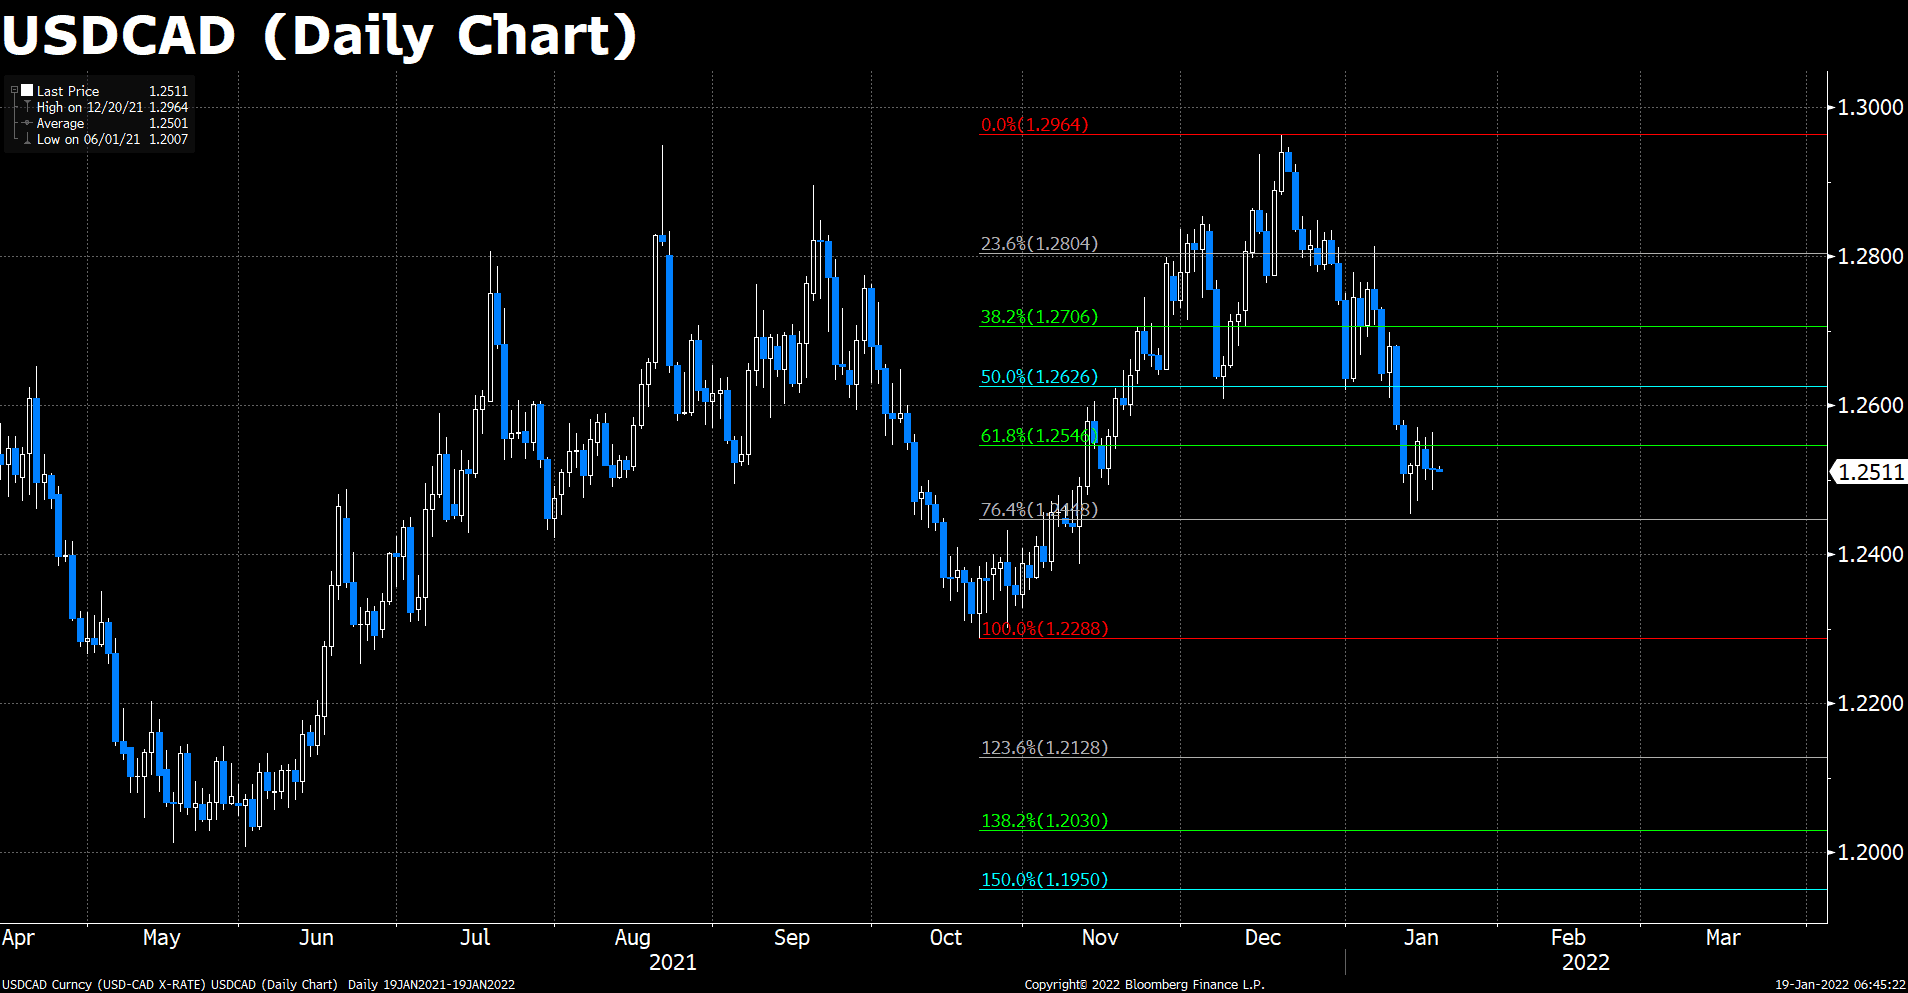
Loonie has had a subdued session on Tuesday, with the pair having dropped back to trading just above its 200-day moving average at the 1.2500 level after briefly surpassing the 1.2550 mark midway through US trade. Surging crude oil prices failed to push USD/CAD below support in the 1.2500 area, with the pair supported by a broad recovery in the US dollar as US government bond yields advanced to reflect new hawkish Fed tightening bets ahead of next week’s meeting.
From the technical perspective, the pair’s mid-term bearish tractions seems to be weakened a lot during January’s trading, indicating that the recent sharp pullback from the December high might soon be over. That said, repeated failures to find acceptance below the 1.2500 mark shows the unlikelihood to set off any further near-term depreciating move.
Resistance: 1.2550, 1.2630, 1.2700
Support: 1.2450, 1.2290
Economic Data:
|
Currency
|
Data
|
Time (GMT + 8)
|
Forecast
|
|
GBP
|
CPI (YoY) (Dec)
|
15:00
|
5.2%
|
|
USD
|
Building Permits (Dec)
|
21:30
|
1.701 M
|
|
CAD
|
Core CPI (MoM) (Dec)
|
21:30
|
|
|
GBP
|
BoE Gov Bailey Speaks
|
22:15
|
|
|
|
|
|
|
|
|
|
|
|
|
|
|
|
|


