December 19, 2021
Market Focus
US stock declined on Friday amid downbeat market sentiment, dropping to two-weeks lows as traders and market participants weigh up this week’s main macro narratives, including the Fed’s hawkish pivot. The Fed and the European Central Bank both started to tighten their monetary policy, given the fact that they see inflation pressures as a higher priority than protecting output and employment from further pandemic fallout. More bad news for equity investors, the Fed might need to end its upcoming hiking cycle sooner, which suggest that the stock markets are due for a rougher patch and the economic growth could be at risk. Long-term US bond yields also fell on Friday, weighing on the appeal of cyclical stocks. On top of that, concerns about the spread of Covid-19 still remained, as New York reports over 20,000 cases in single-day record and caused a wave of school closings as well as business disruptions.
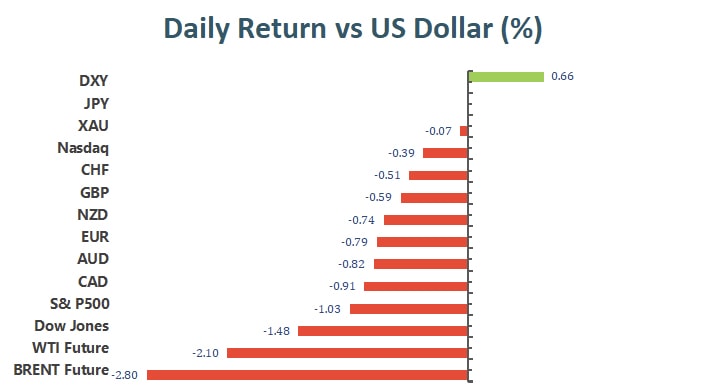
The benchmarks, S&P 500, Nasdaq 100 and the Dow Jones Industrial Average both dropped on Friday amid downbeat market mood and a perspective that Fed is about to speed up to end its asset purchases sooner than planned. S&P 500 was down 1.0% on a daily basis and the Nasdaq 100 declined with a 0.4% loss for the day. All eleven sectors stayed in negative territory as the energy and financial sectors are the worst performing among all groups, losing 2.27% and 2.24%, respectively. The the Dow Jones Industrial Average dropped the most with 1.5% loss on Friday and the MSCI World index fell 0.9%.

In Asia, the focus in China is on the loan prime rate decision. A property sector crackdown has weighed on economic expansion and calls for a rate cut are now gaining momentum, despite the Chinese central bank’s benchmark hasn’t been cut since April 2020.

Main Pairs Movement:
The US dollar advanced on Friday, staying in positive territory amid risk-off market sentiment. The DXY index climbed to a daily top around 96.67 area near the end of the day, as the hawkish Fed and the renewed weakness in stock markets both pushed the greenback higher. The Federal Reserve Governor Christopher Waller said that rates could rise as early as March, following a decision to end asset purchases sooner than planned. Additionally, the Summary of Economic Projections, also known as SEP, also showed that the US central bank policymakers expect three rate hikes by the end of 2022, projecting the FFR at 0.90%.
GBP/USD declined 0.64% on Friday amid renewed US dollar strength, falling back to 1.330 area after the BoE surprised markets with a 15bps rate hike on Thursday. The cable touched a daily top in early European session, then retreated back to surrender most of its intraday’s gain. Meanwhile, EUR/USD dropped to a daily low under 1.124 level, losing 0.82% for the day.
Gold edged lower and touched a daily low around $1795 in late American session. The falling US stock market failed to pushed the precious metal higher, which dropped 0.06% on a daily basis. Meanwhile, WTI oil tumbled 2.18% for the day, as market’s risk appetite faded amid this week’s hawkish turn from many G10 central banks and a continued rise in Omicron cases across the world.
Technical Analysis:
XAUUSD (4- Hour Chart)

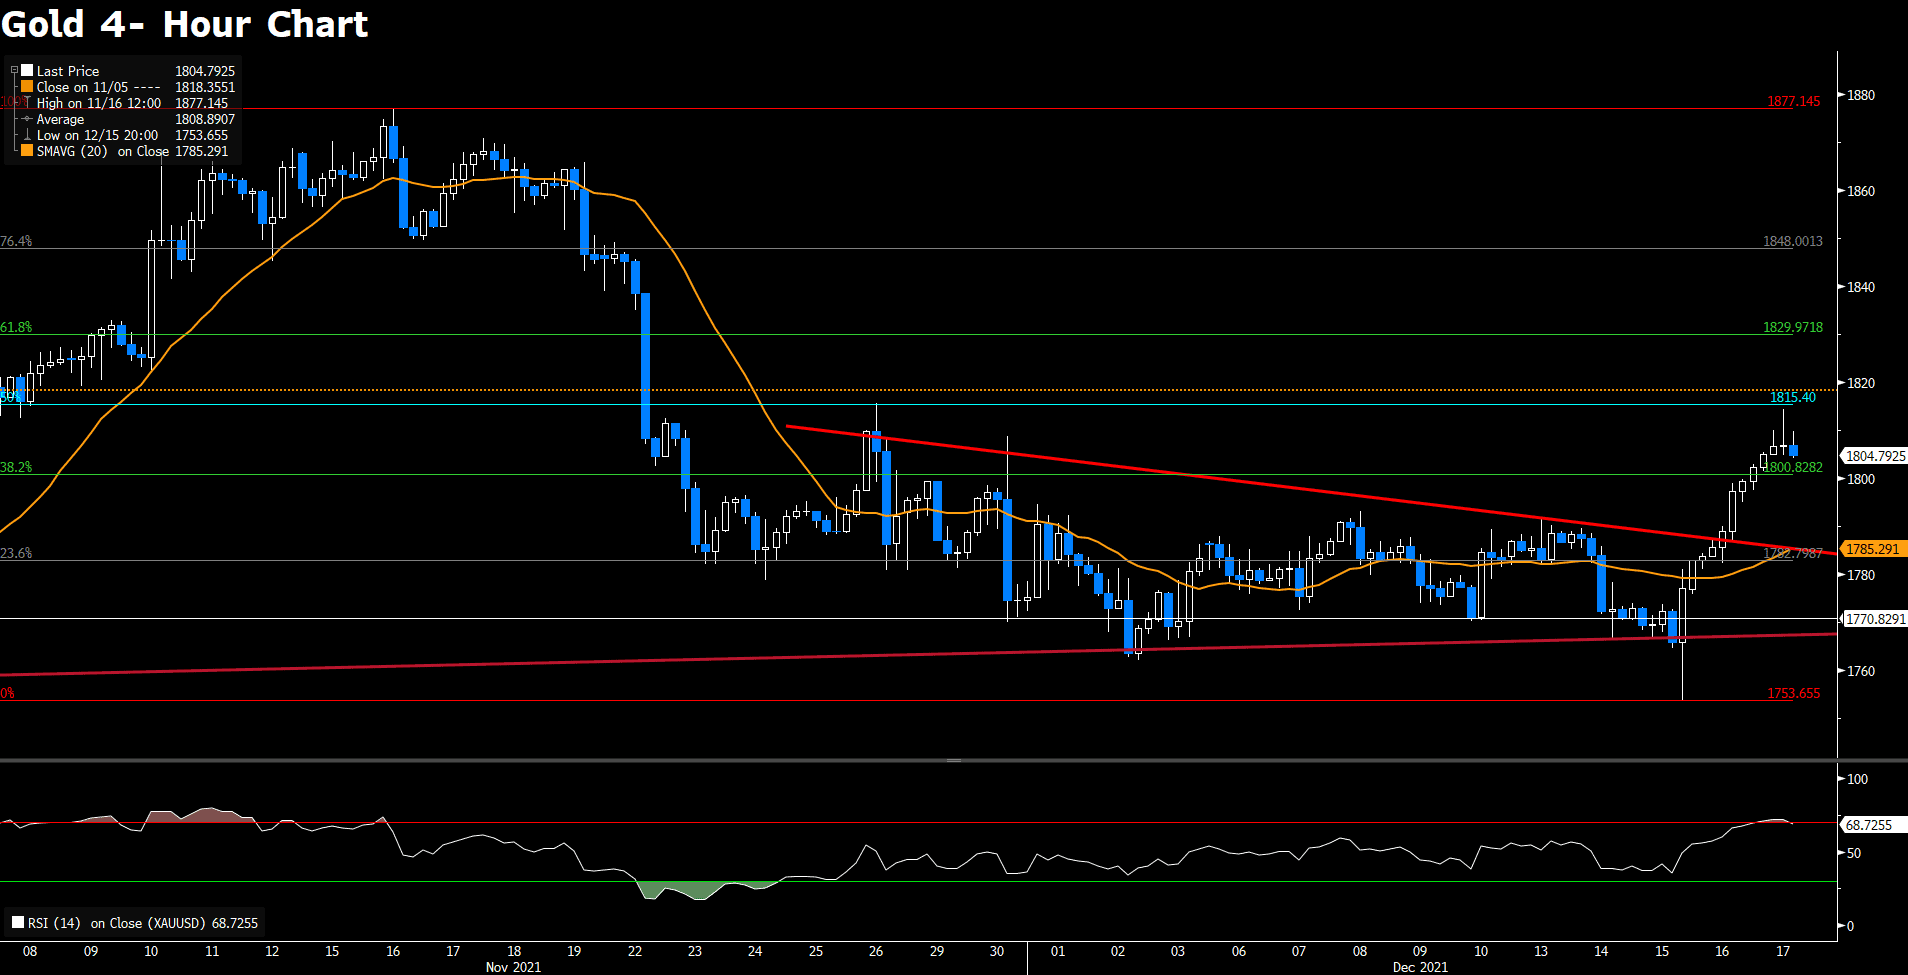
Gold rides higher on the hawkish central banks’ decisions, having taken out the psychological level at 1800. The renewed upside in gold price might get the stanta rally io. From the technical perspective, the intraday bias turns bullish on the 4- hour chart as gold has overcame the critical psychological resistance at 1800. If the latter is scaled, the gold will head toward its next immediate resistance at 1815; nonetheless, the upside momentum might be capped as the RSI indicator has reached the overbought territory, suggesting a pullback. Selling interest can begin accelerating once gold price falls below 1800 again, opening floors toward the previous descending wedge.
Resistance: 1815, 1829
Support: 1800, 1782, 1770, 1753
GBPUSD (4- Hour Chart)

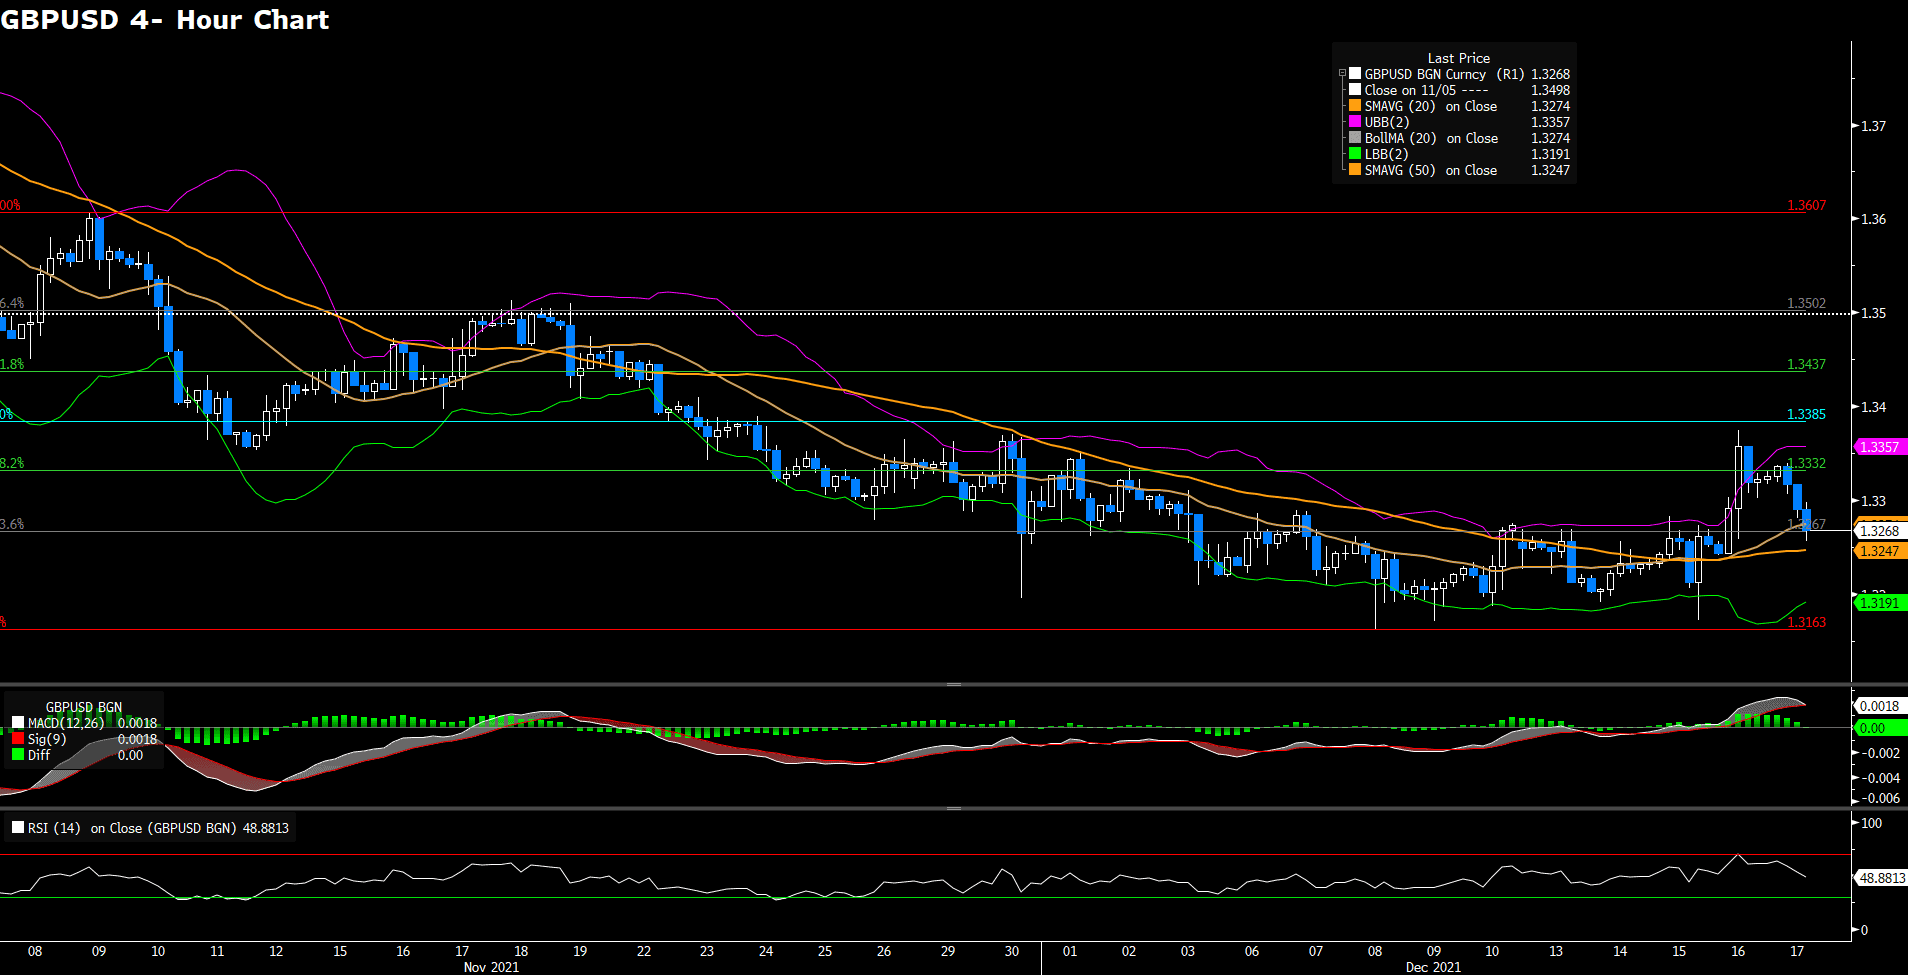
GBPUSD erases most of the gain from yesterday after the BOE’s hawkish tone as the US dollar holds steadily above 96.00. From the technical analysis, GBPUSD looks to head back to a consolidation phase in the 1.3332- 1.3163 range. As the time of writing, GBPUSD is at a critical point, the intersection of the 20 SMA and the support at 1.3267; if the pair falls below the level, then it will turn downside in the near- term. From the technical indicator, the RSI looks to favor sellers while the MACD starts turning south side, suggesting that buyers side is less powerful. As a result, the currency pair might gradually shift to selling side.
Resistance: 1.3321, 1.3419, 1.3499
Support: 1.3267, 1.3163
AUDUSD (4- Hour Chart)

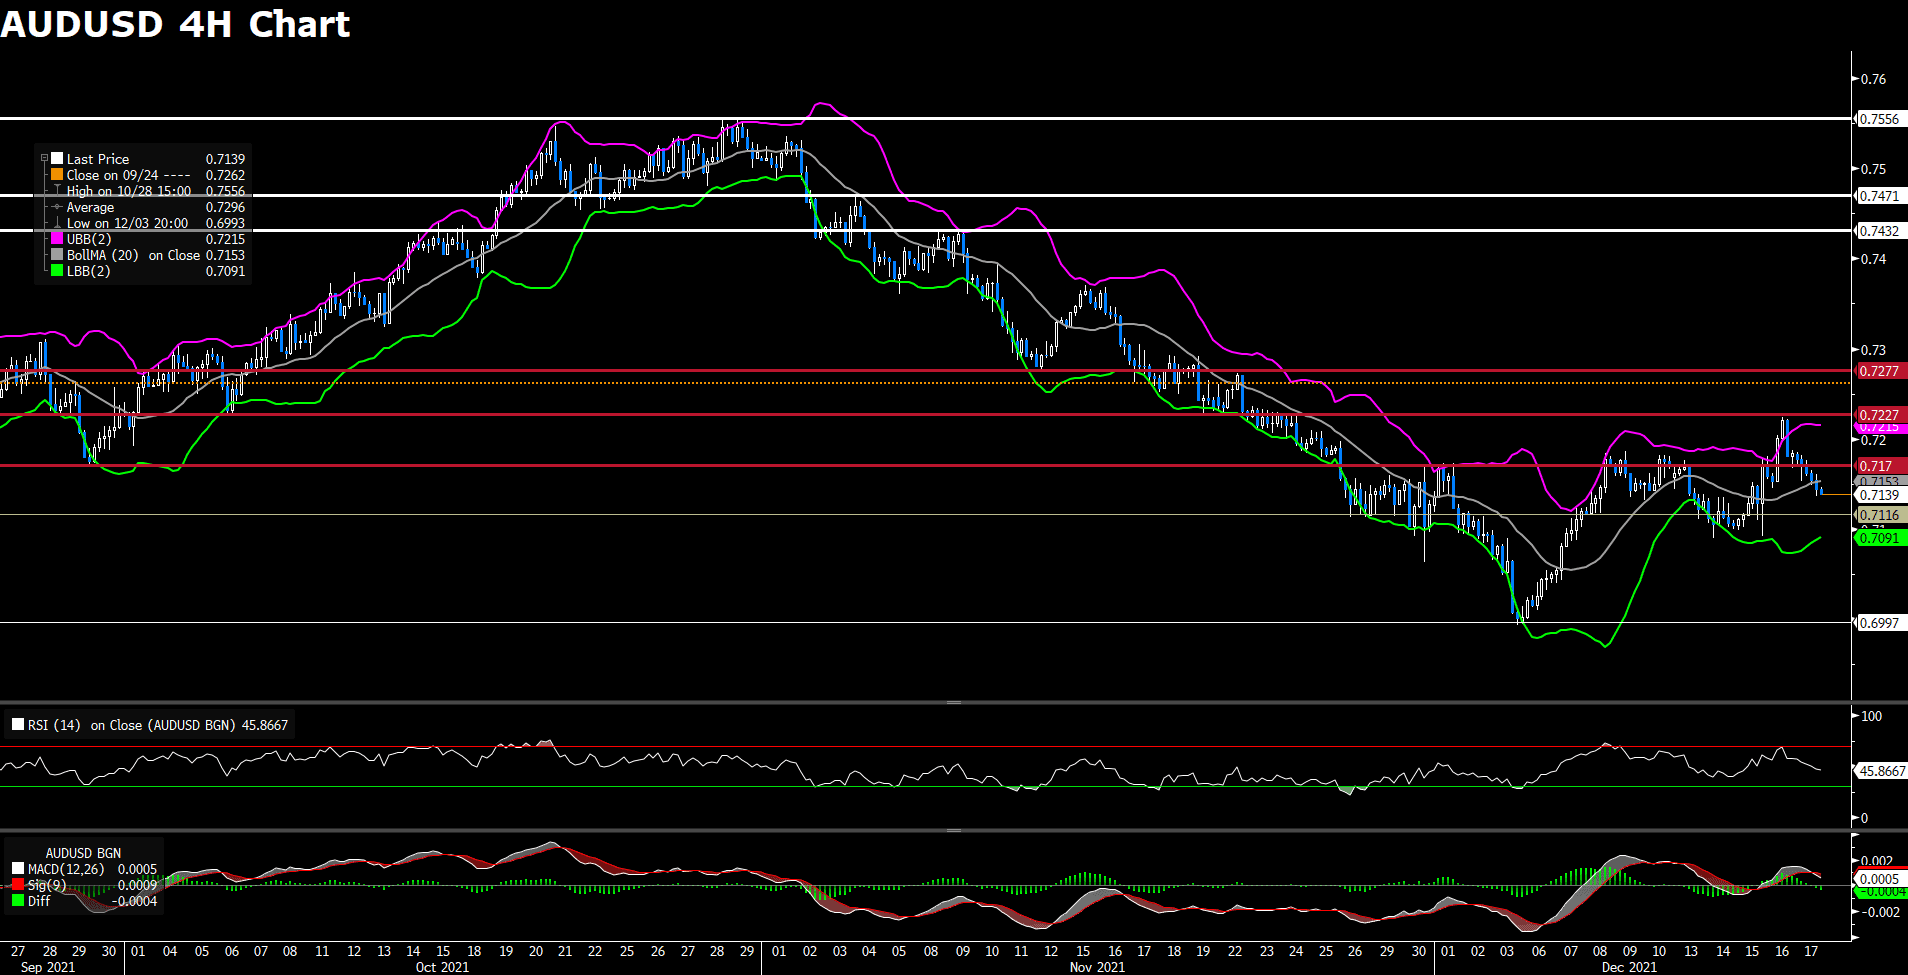
AUDUSD trims early gains from this week, trading at 0.7142 as the time of writing. The Australian dollar sees a downside as the markets appear to making the assumption that economic disruption in Australia will likely happen as the new variant Covid spreads more rapidly. From the technical aspect, the Aussie sees a turnaround after testing its monthly high around 0.7227. The outlook of the Aussie remains neutral as the pair seems to fall back to the consolidated phase, and the range is looking to fall within 0.717 and 0.7116. For the time being, the Aussie is expected to continue heading toward its immediate support at 0.7116 as the RSI is leaning down, suggesting that the sellers are more favorable; at the same time, the MACD becomes negative, giving the pair rooms to extend further south.
Resistance: 0.7170, 0.7227
Support: 0.7116, 0.6997
Economic Data
|
Currency
|
Data
|
Time (GMT + 8)
|
Forecast
|
|
AUD
|
Mid-Year Economic and Fiscal Outlook
|
08:30
|
N/A
|
|
CNY
|
PBoC Loan Prime Rate
|
09:30
|
N/A
|
|
|
|
|
|
|
|
|
|
|
|
|
|
|
|
|
|
|
|
|
|
|
|


