December 9, 2021
Market Focus
After the last two consecutive days of impressive rally, the market was relatively quiet on Wednesday. U.S. stocks have been hesitant after determining their direction in the first hour of opening. At the end of the market, the Dow Jones Industrial Average rose 0.10% to 35,754.76 points, the S&P 500 index rose 0.31% to 4,701.22 and the Nasdaq Composite Index, rose 0.45% to 15,757.04 points. In the absence of economic data, the index has no additional impetus, but the number of initial jobless claims and CPI will be announced in the next two days, which may provide some momentum for the index trend. In the bond market, the 10-year Treasury bond yield rose to 1.528%, the third consecutive rise. Investors are waiting for the Fed’s meeting next week to see whether officials will accelerate the pace of reducing asset purchases.
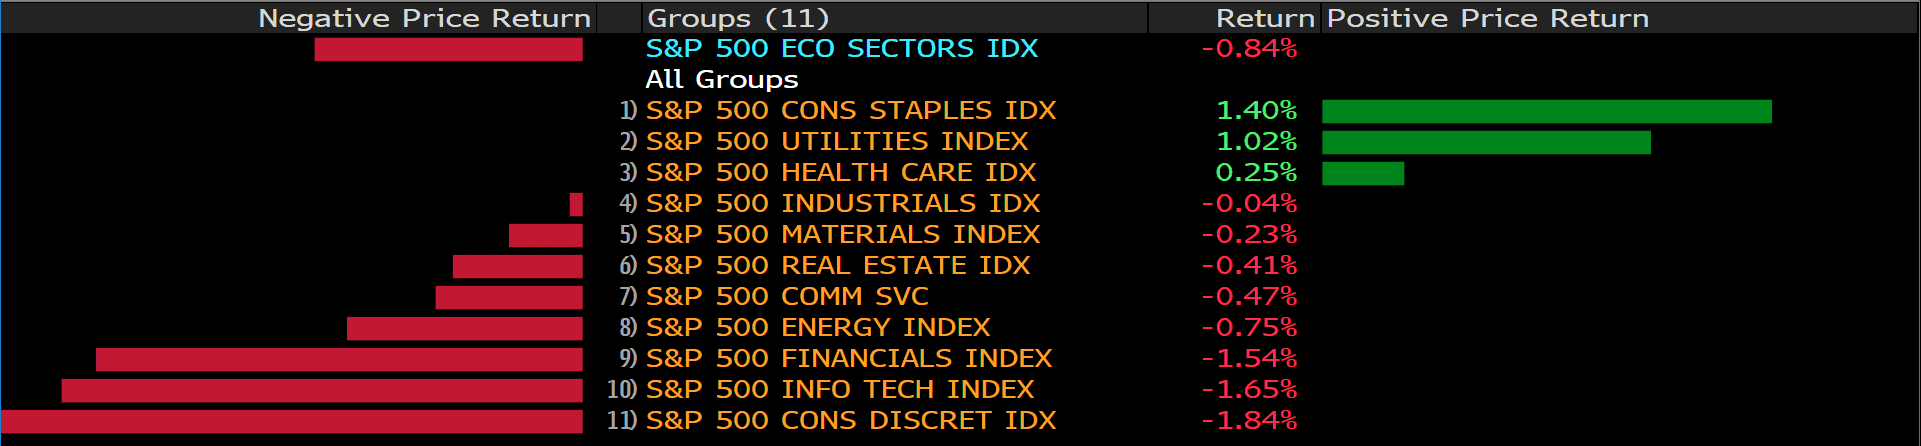
In the S&P 500 index sector, the communications services sector and the healthcare sector were the two biggest winners on Wednesday. In the communications sector, Roku Inc. and Stagwell Inc. rose 18.23% and 10.28%, respectively. On the other hand, in the Nasdaq Composite Index, which is dominated by technology stocks, Apple’s stock price rose 2.28% to a record high, Meta rose 2.4%, and Zillow Group rose 4.25% to lead the rise of technology stocks.

Main Pairs Movement:
Since the opening of the London trading hours, the U.S. dollar has been weakening, but it closed stronger than most major competitors. Currently, market full of the anxiety on the new coronavirus, Omicron, trading has been fluctuating throughout the day. At present, the market is still full of anxiety about the new coronavirus Omicron, and the trading market fluctuates throughout the day. With the escalation of infectious diseases in Europe, France, the United Kingdom and Germany announced restrictions. Fortunately, Pfizer stated that its booster injection of the coronavirus vaccine is effective for the Omicron variant.
Despite the lack of macroeconomic data release, the EUR/USD has recently rebounded to the 1.1350 area, while the AUD/USD has returned to above the 0.71435 level and continues to try to return to the 0.72 area.
After the British Prime Minister announced his so-called “Plan B” to contain the latest coronavirus outbreak. GBP/USD weakened and maintained a downward trend, and may continue to refresh the lowest level this year.
Gold is still at a familiar level and is currently trading at approximately $1,786.00 per troy ounce. Crude oil prices rose slightly, and WTI is currently quoted at $72.40 per barrel.
Technical Analysis:
AUDUSD (4- Hour Chart)

The Aussie extends its rally, currently challenging its immediate hurdle at 0.7170. From the At present, the market is full of anxiety about the new coronavirus Omicron, and trading fluctuates throughout the day. With the escalation of infectious diseases in Europe, France, the United Kingdom and Germany announced restrictions.
On the other hand, Pfizer stated that the booster injection of its coronavirus vaccine is effective for the Omicron variant. Early studies have shown that people who have been infected with the new coronavirus and have been vaccinated twice or the third dose are highly protected by the highly mutated virus strain. From a technical aspect, the outlook of AUDUSD turns upside after it breaches the bearish channel on the 4- hour chart. The pair is facing the critical resistance at 0.7170; the breach of the latter will expose a one- month down slope trendline, previous resistance- turned- support. Nonetheless, the breach would be difficult as the RSI has hit the overbought territory and the pair has reached the upper bounce of Bollinger Band, suggesting a pullback. To the downside, if the pair fails to break 0.7170 level, then it is expected to head toward 0.7116 for an adjustment. On the contrary, if the pair successfully penetrates 0.7170, then it is expected to head further north, toward 0.7227.
Resistance: 0.717, 0.7227
Support: 0.7116, 0.6997
GBPUSD (4- Hour Chart)

The Cable plummets to fresh 2021 lows around sub- 1.3200 as the greenback recovers. In the meantime, impending Brexit risks and new variant Covid weigh on the British Pound. From the technical perspective, the outlook of GBPUSD looks bearish on the 4- hour chart as it continues to trade within the descending channel. Despite of hitting the lower bounce of Bollinger Band, the bearish momentum seems unstoppable as the RSI has not reached the oversold territory and the MACD is still negative. As the time of writing, the pair is aiming for the next immediate support at 1.3163 before the bearish momentum takes a break.
Resistance: 1.3321, 1.3419, 1.3499, 1.3578
Support: 1.3163
EURUSD (4- Hour Chart)

EURUSD recovers the 1.1300 threshold while the US 10- year yield hovers around 1.5%. From the technical perspective, the pair turns bullish in the near term since the pair is currently extending above the 20 and 100 simple moving averages in the 4- hour chart, but not yet overcoming its resistance at 1.1357. The pair needs to trade above the acceptance level at 1.1357 to maintain its bullish trend. At the moment, the RSI indicator has not yet crossed the overbought line, providing more rooms to extend further north; in the meantime, the bullish momentum is supported by the positive MACD. To the downside, if the pair falls below its 20 and 100 simple moving averages, then it might head toward its support at 1.1186, turning back to the bearish mode.
Resistance: 1.1357, 1.1462, 1.1548
Support: 1.1186
Economic Data
|
Currency
|
Data
|
Time (GMT + 8)
|
Forecast
|
|
CNY
|
CPI (MoM) (Nov)
|
09:30
|
0.3%
|
|
CNY
|
CPI (YoY) (Nov)
|
09:30
|
2.5%
|
|
CNY
|
PPI (YoY) (Nov)
|
09:30
|
12.4%
|
|
USD
|
Initial Jobless Claims
|
21:30
|
215K
|
|
|
|
|
|
|
|
|
|
|
|
|
|
|
|
|
|
|
|
|
|
|
|
|
|
|
|
|
|
|
|
|
|
|
|
|


