September 29, 2021
Daily Market Analysis
Market Focus
US stock tumbled on Tuesday, dropping the most since May. The concern over the debt-ceiling deadlock in Washington had accelerated the selloff in risk assets. Republicans blocked a Democratic move in the senate to raise the debt limit, even though it’s only less than three weeks before the Treasury potentially runs out of capacity around October 18. Therefore, a government shutdown is a risk factor that investors will be watching in the coming days and weeks.
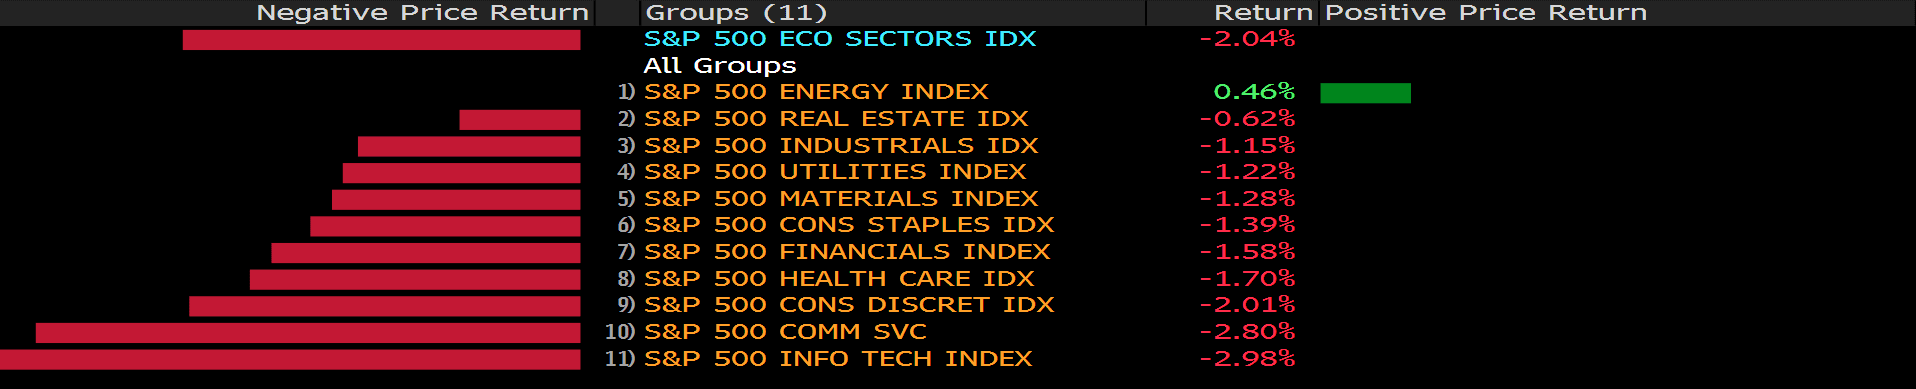
The benchmarks, the S&P 500 and the Dow Jones both declined on Tuesday. The S&P 500 was down 2% on a daily basis, extending its September selloff. The energy sectors continued its bullish momentum, rising 0.46% on Tuesday. The info tech and communication service sectors are the worst performing among all groups, dropped 2.98% and 2.8%, respectively. The Nasdaq, in the same way, declined the most since March and posted a 2.8% loss for the day.
In addition to the concern about a federal payments default, US senator Elizabeth Warren said that Fed Chair Jerome Powell is a dangerous man and she’ll oppose his renomination, this also weighed on the market sentiment. On top of that, US consumer confidence fell in September for a third straight month, showing that people still worried about the delta variant. Higher prices also continued to hurt sentiment. The surging energy prices keep heating up the inflation and implicate the economic recovery.

Main Pairs Movement:
The broad U.S. equity market experienced a pullback due to rising short term bond yields and markets participants reacting to the worse than anticipated consumer confidence report. Short term bond yields have been affected by a potential delay of payment as Treasury Secretary Janet Yellen told Congress that the government could reach its borrowing limit by October 18th. Rising bond yields, in theory, should strengthen the U.S. dollar; in fact, the DXY, which measures the dollar against a basket of major currencies, has risen for the third consecutive day.
Most currencies declined against the Dollar as the Greenback gained strength on the back of brewing “risk off” sentiment and rising yields. Cable struggled as domestic woes continue and the Dollar gained strength throughout the trading day. GBP/JPY dropped to a fresh weekly low as the Pound suffered. Gold continues to decline as the Greenback comes out ahead as the safe haven asset of choice.
Technical Analysis:
GBPUSD (4 Hour Chart)

Cable tumbled during Tuesday’s trading. Sterling lost more than 1% against the dollar as the Greenback gained strength amid soaring short term U.S. bond yields. Cable dropped to its lowest level since July and is trading at 1.3536, as of writing. Concerns for the Pound’s short term outlook has been exacerbated due to the recent supply disruption of fuel in the U.K.. It is also important to note that BoE’s Governor Bailey’s speech, yesterday, sheds light on the concerns over a slower than expected recovery of the labour market, thus the BoE’s recent hawkish tone could, again, turn dovish if recovery signals shows signs of weakness.
On the technical perspctive, Cable has broken through the two levels of support, at 1.3665 and 1.3603. As of writing, the pair seems to have found support around the 1.352 price region. RSI for the pair sits at 27, indicating strong over selling. Cable is trading below its 50, 100, and 200 day SMA.
Resistance: 1.3687, 1.3717
Support: 1.35281, 1.3446
GBPJPY (4 Hour Chart)

Risk averision sentiment has helped propelled the Yen against the Sterling; however, speculators are now betting on the BoE’s hawkish stance and a possible rate hike ahead of the U.S. Fed. Potential rate hike and a hawkish BoE has helped contain losses in the pair. On the other hand, strong headwinds persist for the Pound. A combination of feul supply disruption and intensifying enery crisis in Europe and China has hindered upward movement of the Pound.
On the technical perspective, GBP/JPY wiped out most of yesterday’s gain and currently trading near the key support level of 150. RSI for the pair sits at 46.4, indicating a neutral market. GBP/JPY is trading below its 50, 100 day SMA but above the 200 day SMA.
Resistance: 151.356, 152.555, 153.2886
Support: 150.602, 150.168, 149.129
XAUUSD (4 Hour Chart)

XAU/USD suffered on Tuesday’s trading as the Dollar continues to gain strength on the back of rising U.S. bond yields and a hawkish Fed. XAU/USD fell, as much as, 0.8%, intraday, attributed to weak Gold buying, market sentiment turning slightly “risk off”, and investors rushing to the safe haven Dollar as short term bond yields increase. Investors will be looking out for Fed Chair Jerome Powell’s speech, scheduled for later tomorrow, as it could bring further volatility to XAU/USD.
On the technical perspective, XAU/USD has dropped below our previously estimated support level of 1742.39, and the pair is trending lower towards the next immediate support level of 1725.21. RSI for the pair sits at 37, indicating bearish buying sentiment. XAU/USD is trading below its 50, 100, and 200 day SMA.
Resistance: 1759.27, 1779.04, 1808.42
Support: 1742.39, 1725.51


