April 13, 2021
Daily Market Analysis
Market Focus
U.S. stocks slipped from record highs while investors weighed the start of corporate earnings season and an influx of bond supply that loom as speedbumps to a roaring rally.
Intel Corp. led tech shares lower after Nvidia Corp. said it’s offering the company’s first server microprocessors, extending a push into Intel’s most lucrative market. The S&P 500 dipped into negative territory in the wake of a third straight week of gains for the benchmark index. In Europe, the Stoxx Europe 600 Index weakened.
Yields were mostly higher as the U.S. Treasury auctioned three- and 10-year notes at slightly lower demand than the previous sales of the securities. The government will offer 30-year bonds tomorrow.
While the U.S. recovery is accelerating, parts of Europe and South America are beset by rising Covid-19 cases and troubled vaccination rollouts. The rotation toward cyclical and small-cap stocks appears to have stalled as well, prompting worry about the strength of the U.S. economic comeback at the start of earnings season.
 At the same time, massive government spending and central-bank stimulus could stoke excessive inflation. In an interview aired Sunday with CBS’s 60 Minutes, Federal Reserve Chair Jerome Powell sought to provide reassurance that any surge in price pressures won’t last.
Market Wrap
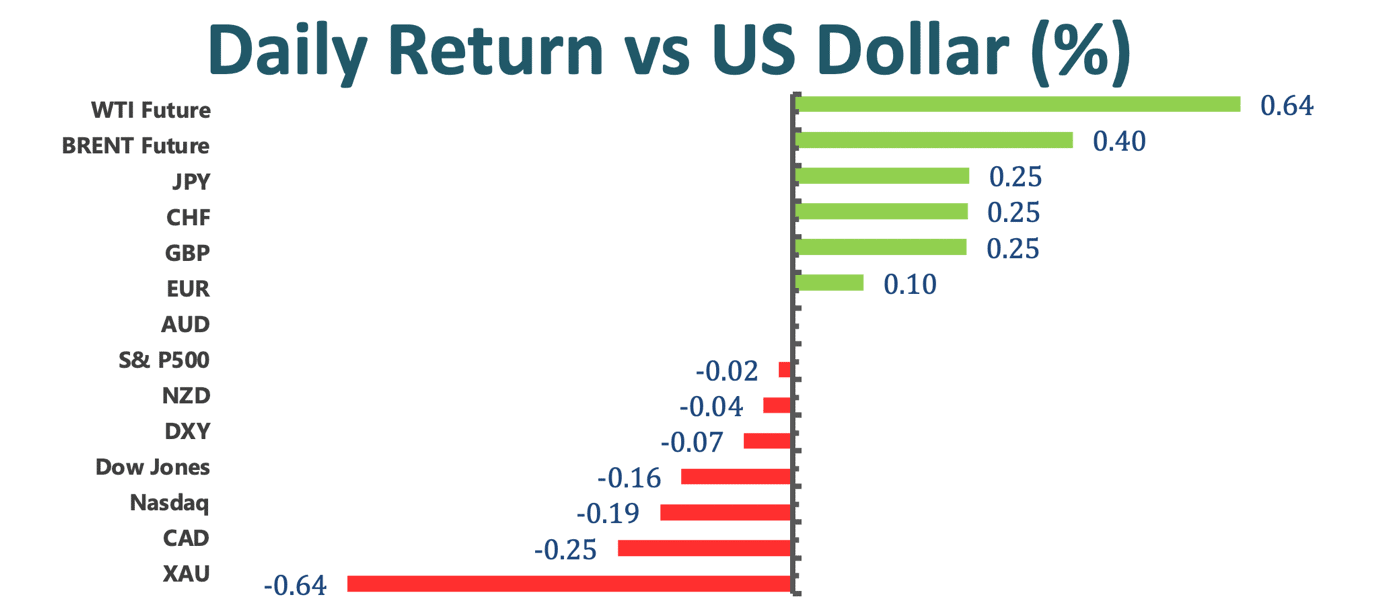
Main Pairs Movement:
The dollar pared losses as yields hovered near session highs, after 10-year notes drew the highest rate at an auction of the tenor since January 2020. Traders are turning their attention to U.S. inflation data Tuesday expected to show a pickup.
USD/JPY slipped 0.2% to 109.43; pair supported by outright buying interest near ~109.25. EUR/USD +0.1% to 1.1914; offers capped ahead of the 1.1920 pivot level; trading just above the 200-DMA of 1.1900, with support seen at 1.1860; sees trading interest in 3-month call spreads. GBP/USD +0.3% to 1.3742; rose as much as 0.5%, the most since April 5, as the U.K. took the next step in reopening the economy. A close above 1.3751 would be a bullish signal and a hold around that level sets up the possibility for a double bottom with a neckline at 1.3919; a close above there suggests an eye toward 1.4170.
Elsewhere, oil rose with the dollar little changed. Bitcoin neared an all-time high before a listing by the largest U.S. cryptocurrency exchange.
Technical Analysis:
EURUSD (Four- Hour Chart)
 The euro dollar continue consolidation in tiny range between 1.194 and 1.1877 which accord our recently perspective, trading at 1.1908 as of writing. Earlier in the day, Eurostat revealed Retail Sales in February increased by 3% following January’s contraction of 5.2%. This data beat the market expectation of 1.5% and helped the shared currency stay resilient against its rivals. On RSI side, indicator shows 60 figure which suggest a bullish momentum for ongoing short term. On average price momentum perspective, 15 and 60-long SMAs remain it upward movement, yet 15-long SMAs turn flat sign.
Therefore, we believe market will still quagmire in a slightly move range. However, aforementional indicator are giving an upward expectation. On up side, if first upper bounder breakthrough, then eye on 1.199 level. On slid side, 1.1877 level of course will be the vital support for first defend level. If penetrate first level, then price will see other lower level.
Resistance: 1.1941, 1.199
Support: 1.1871, 1.1796, 1.1705
USDCHF (Four-Hour Chart)

Swiss Franc is continue lossing it bullish that trading at lower level intraday, hits fresh one month lows, which settle around 0.9221 level while market close. On four hour chart, it is obviously that swiss franc has built up a double head pattern at higher price action level. However, we didn’t see it formed as typical symmetry double head pattern. On RSI side, indicator show 34 figure, suggesting there still remaining a bearish space in short term, moreover, 15 and 60-long SMAs are extending upwind momentum.
Therefore, integrity all suggestion above, indictors expect swiss franc will toward to downside movement. However, we more inclined to form another head price action. On down side, it is sucessively testing month-long lows around 0.922 level currently, so we deem month-long low level will be the critical support at the moment. if breakthrough support level firmly, we see lower price spot. On contrast, if marketplace intend to built up another head which will become thriple head pattern, first upward resistance will 0.9268, 0.9309 is subsequent.
Resistance: 0.9268, 0.9309
Support: 0.922
XAUUSD (Four-hour Chart)

After fail to challenge stand above the head level of “W shape” pattern, gold is continue tamp down to lower level in the day, trading at 1732.75 while end of day. On RSI side, indicator drop below to 42 which suggest a bearish momentum ahead. On the other hands, 15 and 60-long SMAs indicator remain a ascending trend, yet seemingly turn flat.
Combing suggestion above, we foresee marketplace will continue it bearish movement. However, we see 1722.75 level should be the first and cogent barrier.
Resistance: 1754.53, 1759.72
Support: 1722.75, 1678.85
Economic Data
|
Currency
|
Data
|
Time (GMT + 8)
|
Forecast
|
|
GBP
|
Manufacturing Production (MoM)(Feb)
|
14:00
|
0.5%
|
|
GBP
|
Monthly GDP 3M/3M Change
|
14:00
|
–
|
|
EUR
|
German ZEW Economic Sentiment (Apr)
|
17:00
|
79
|
|
USD
|
Core CPI (MoM)(Mar)
|
20:30
|
0.2%
|
|
|
|
|
|
|
|
|
|
|
|
|
|
|
|
|
|
|
|
|
|
|
|
|
|
|
|
|
|
|
|
|
|
|
|
|


