April 6, 2021
Daily Position Report
Market Focus
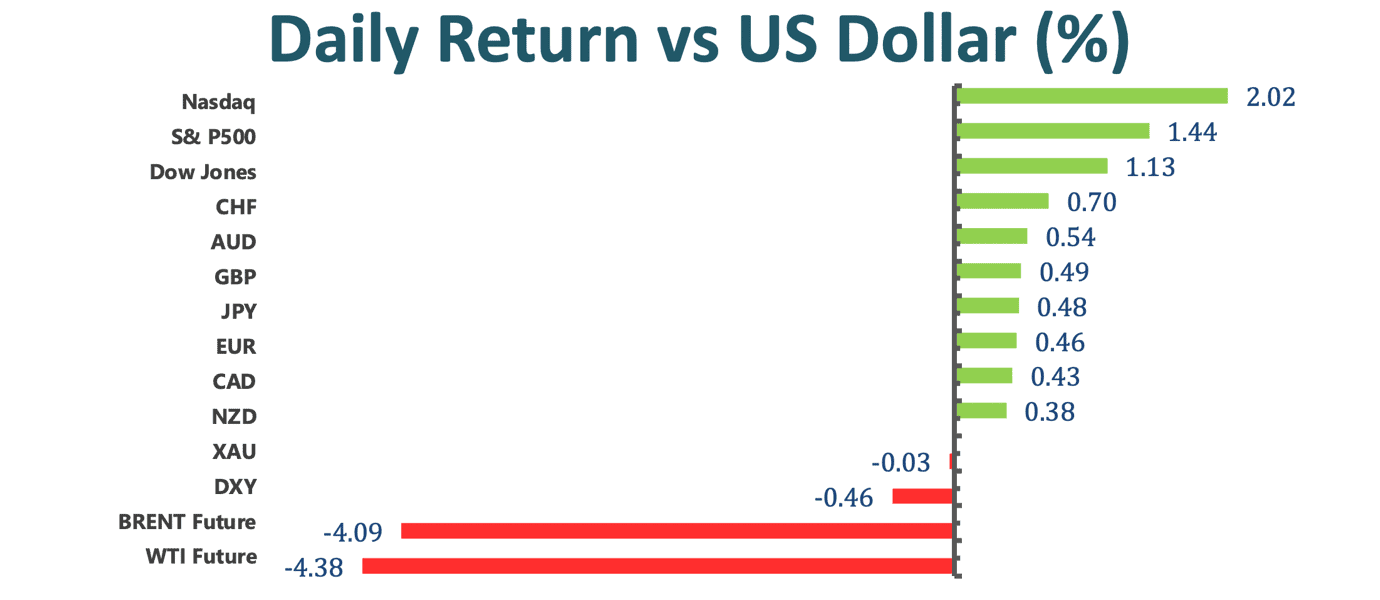
US stocks climbed toward another record high after the economic recovery is being evidenced, thus gaining momentum. The Dow Jones Industrial Average extended
370 points to an all-record high; the S&P 500 climbed 1.4% while the Nasdaq rose 1.6% today. Investors pushed up the value of stocks after economic date highlighted accelerating growth as more Americans are vaccinated. Especially, US service providers has the fastest growth on record in March, boosting investors’ confidence on the economic recovery. In the meanwhile, speculators have shown the sign by pulling back their net short position in Cboe Volatility Index futures for six straight weeks to their lowest.


Treasury Secretary Janet Yellen planned to end Trump’s global retreat, restoring global leadership and credibility with US allies following the unilateralist approach of the Trump era and eyeing on a harmonized corporate tax rate across the world’s major economies. Yellen also criticized the strategy of Donald Trump’s administration, decrying four years when the US isolated itself by retreating from the international order.
UK Boris Johnson put hope on the resume of foreign travel on May 17. UK’s lockdown is being gradually eased, and people are now allowed to meet outside in groups of six. Boris Johnson also confirmed that some stores can open from April 12 as planned. As the vaccine rollouts become more efficient, and free rapid Covid tests become more available, UK is now in the stage of considering whether it should suspend its travel bans.
Tencent and Alibaba remain the benchmark for China tech stocks despite Beijing continues to ramp up regulatory pressure on its tech firms. Chinese State Administration for Market Regulation has fined more than 12 companies on the violation of anti- monopoly rules so far.
Market Wrap
Main Pairs Movement:
Oil futures in New York dropped more than 4.5% today, sending prices to the lowest in more than a week. Oil prices plummeted as growing delays in Europe’s reopening and looming Iranian supply dampened hopes for a decline in global oil inventories. Moreover, investors eyed on the meeting in Vienna on Tuesday to discuss potentially resurrecting the agreement, a possible path toward removing sanctions on the Middle Eastern country’s oil exports.
Lonnie closed lower below 1.2550 even though oil prices dropped. The broad- based decline of the US dollar weighs on USD/CAD. With the US dollar facing a renewed selling pressure, however, the pair edged lower.
The British Pound reached three- week highs above 1.3900 against the US dollar. Pound self- strength coupled a weaker US dollar. As the UK is in a good shape in the battle against the Covid, GBPUSD sharped up today.
The second largest cryptocurrency, Ethereum, has been acting strong recently on the news that Visa would be using the ETH network to settle cryptocurrency transaction, trading around $2117 as the time of writing. With ETH’s recent move, ETH finally breaks away from the tendency to track the price movements of Bitcoin. ETH is no longer playing second fiddle to Bitcoin.
Technical Analysis:
EURUSD (Daily Chart)

EURUSD witnesses some postive move today, trading at 1.1809. The near- term picture is bullish, with scope for another leg higher. The pair is expected to climb toward 1.1855 where the horizontal line for the previous double tops formation. The bullish momentum in the near- term is supported by the RSI of 43, which is outside of the oversold condition, giving it more room to extend further north. In a bigger picture, EURUSD remains bearish as it continues to fall within the descending channel and trades below the 50 and 100 SMAs. On the upside, above 1.1855 minor resistance will turn bias back to the upside for 1.1945 resistance.
Resistance: 1.1855, 1.1945, 1.12349
Support: 1.1695, 1.1492, 1.1290
GBPUSD (Four Hour Chart)

GBPUSD keeps up its bullish momentum, reaching three- week highs above 1.3900. On the four hour chart, the pair has surpassed the 100 SMA, heading to the next immediate resistance at 1.3926. However, the RSI indicator is currently within the overbought area, suggesting a pull back before continues GBPUSD’s bullish move. From the technical aspect, the pair is expected to trade in the range of 1.3877- 1.3926 during the time of an adjustment. After the RSI becomes less, the pair is expected to trade higher as the MACD remains positive.
Resistance: 1.3926, 1.4005
Support: 1.3877, 1.3838, 1.3798, 1.3749
XAUUSD (Daily Chart)

Gold has been choppy today, stucking within a $1720- $1730 price range for the most of the day. After trading in positive territory for two consecutive day, gold turns bearish, currently trading at $1726. To the downside, the resistance at 1746.91(Fib. Retracement 23.6%) seems to act as a cap for gold buyers; a sustained move under $1746.91 indicate the presence of sellers. If gold fails to challenge $17746.91 again, the possible acceletation to the downside with potential targets below $1676.89 can happen. In the meanwhile, the bullish signal on the MACD indictor is currently weak, implying a possibility of a bullsih- to- bearish trend.
Resistance: 1746.91, 1790.23, 1825.24
Support: 1676.89
Economic Data
|
Currency
|
Data
|
Time (GMT + 8)
|
Forecast
|
|
AUD
|
RBA Interest Rate Decision (Apr)
|
12:30
|
0.10%
|
|
AUD
|
RBA Rate Statement
|
12:30
|
N/A
|
|
USD
|
EIA Short-Term Energy Outlook
|
20:00
|
N/A
|
|
USD
|
JOLTs Job Openings (Feb)
|
22:00
|
6.995M
|
|
|
|
|
|
|
|
|
|
|
|
|
|
|
|
|
|
|
|
|
|
|
|
|
|
|
|
|
|
|
|
|
|
|
|
|


