March 23, 2021
Daily Market Analysis
Market Focus
Nasdaq 100 climbed as high as 2% as the US Treasury yields slid, providing a tailwind for equity markets. Markets also focused on the Federal Reserve’s SLR decision. The Fed is letting expire at the end of March a temporary change to its SLR requirement for banks. The worst scenario is that some of banks have to issue preferred to make room for the increase in deposit, potentially resulting in major selloffs.
Turkish Lira plunged as much as 15% against the US dollar after the Turkish President Erdogan abruptly fired the head of the central bank, putting the Lira for its worst single day decline in nearly three years. Ncai Agbal, who was appointed in November, was the country’s third central bank governor got removed in less than two years. And the reason for the removal was an advocate of lower rates. Agbal’s removal results in a 200 basis- point interest rate hike by the central bank. With the Lira’s freefall, it adds to Turkey’s inflation problem and also risks worsening currency mismatches. Moreover, the rise in external borrowing costs are going to make it harder for Turkish borrower to roll over their external debts.


Market Wrap
Main Pairs Movement
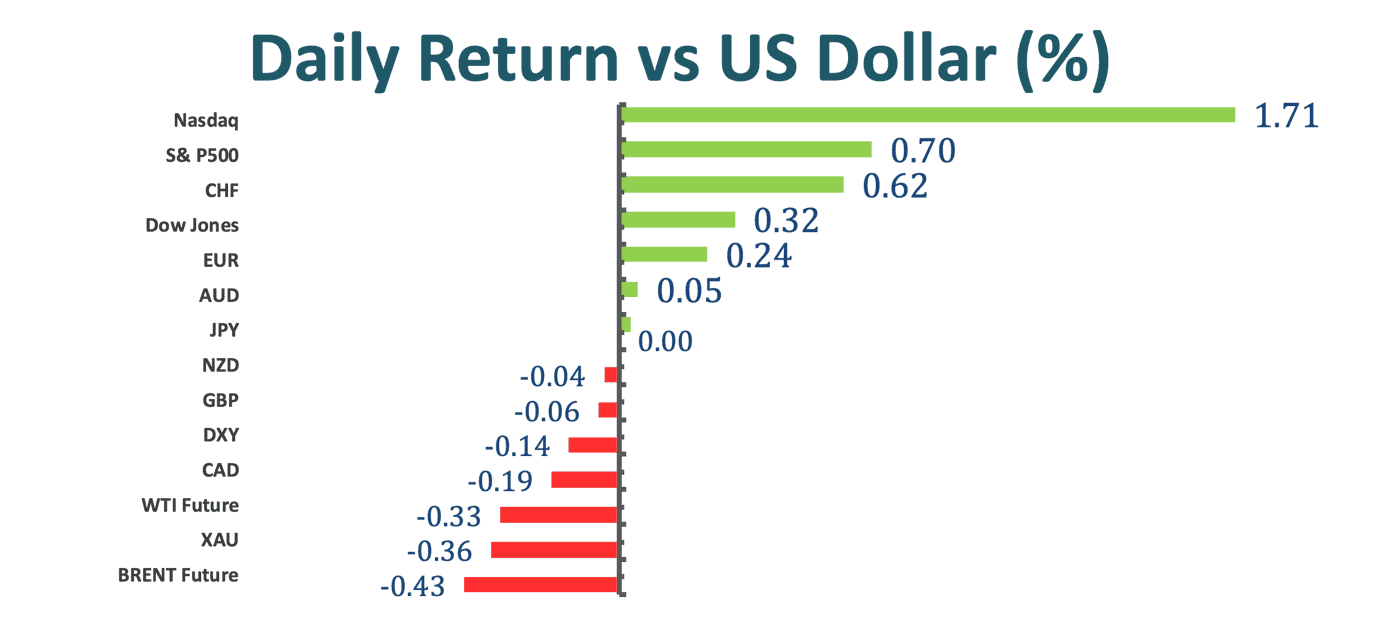
The Aussie climbed to its highest in nearly two weeks following a drop in the jobless rate. The Aussie rose as much as 0.4% today as it was bought by leveraged funds buying for the second time in a day in the wake of a better- than- expected jobless report. Jobless data dropped to 5.8% from an expected 6.3% whilst full- time employment added 89.1k jobs.
The yellow metal, gold turned negative amid concern that the US Treasury yields might rise further even though the yields dropped nearly 1.7% today. Investors took close attention to the heavy slate of auctions with bonds getting pummeled recently amid an optimistic outlook for growth and inflation. As a result, potential gains in gold might not be enough to spur investors to close out bets.
EURUSD reversed its direction and turned in positive, up around 0.28% on the day at 1.1935. Weaker US Treasury yields today continue to drive the US dollar’s performance. On the other hand, the ECB has pointed out that it is ready to adjust all of its instruments to ensure that inflation moves toward a sustained manner.
Technical Analysis:
EURUSD (Daily Chart)

EURUSD has risen above 1.19 level as the US Treasury yields have dropped today, but still trapped in the descending channel on the daily chart. The pair has limited the bullish potential in the near- term as it needs to climb beyond around 1.2124 to give bulls a chance to happen. By rising up above 1.2124, where the yearly ascending trend and short- term descending trend cross, the pair would trade above the 50 and 100 SMAs, giving it a chance to reverse from bearish to bullish. In the near- term, EURUSD is under downside pressure as the RSI indicator has not reached the oversold condition, giving rooms to further south.
Resistance: 1.1945, 1.2349
Support: 1.1695, 1.1492, 1.1290
GBPUSD (Four- Hour Chart)

Cable turns positive as the US Treasury yields trade lower today, resulting in a weaker US dollar. Cable has been setting higher lows since it hit a low of 1.3779 in the beginning of March. On the four- hour chart, the pair has rebounded back to the ascending trend, heading to the next resistance level at 1.3887(Fib. Retracement 23.6%.) Bulls are trying to comeback as the MACD lines are getting narrowed even though cable is currently trading under the 50 SMA; meanwhile, the RSI is still neutral, giving Cable rooms to move further.
Resistance: 1.3887, 1.3954, 1.4008
Support: 1.3779
XAUUSD (Daily Chart)

Gold continues to move up and down between the key resistance hurdle at 1746.91. In a bigger picture, gold is still trapped in the descending channel while trading below the 50 Simple Moving Average. However, in the near- term, the direction of gold is likely to be determined whether the resistance level can be broken. Gold has hovered around the area for a while,thus expecting to see a breakthrough as bullish momentums are very strong at this point. At the same time, the MACD indicator also lends support to the bulls while the RSI is still neutral, giving gold a chance to move forward.
Resistance: 1746.91, 1790.23, 1825.24
Support: 1676.89
Economic Data
|
Currency
|
Data
|
Time (TP)
|
Forecast
|
|
GBP
|
Average Earnings Index +Bonus (Jan)
|
15:00
|
4.9%
|
|
GBP
|
Claimant Count Change (Feb)
|
15:00
|
N/A
|
|
BRL
|
BCB Copom Meeting Minutes
|
19:00
|
N/A
|
|
GBP
|
BoE Gov Bailey Speaks
|
19:50
|
N/A
|
|
USD
|
Fed Chair Powell Testifies
|
22:00
|
N/A
|
|
USD
|
New Home Sales (Feb)
|
22:00
|
875 K
|
|
|
|
|
|
|
|
|
|
|
|
|
|
|
|
|
|
|
|
|
|
|
|
|
|
|
|
|


