March 16, 2021
Daily Market Analysis
Market Focus
US eqity markets turn positive with the Dow Jones, S&P 500, and the Nasdaq are trading in the positive territories. Technology shares led US stocks higher as investors weighed the economic recovery and progress on vaccines against the risk of inflation. Both S&P 500 and the Dow Jones hit fresh records as investors continued keeping eyes on the bond yield, which remains the primary risk facing the stocks markets. In the next upcoming days, the market will have to continually grapple with the anxiety about economic overheating and the upcoming FOCM event.
The US might face the first major tax hike since 1993 in the next economy plan as the President Joe Biden is planning to announce for the purpose of helping pay for the long- term US recovery program. For Biden’s administration, the upcoming changes are an opportunity not just to fund key initiatives, but also address the inequities of Trump’s tax system. Thus, the next economy plan might act as a major turnover of the US tax system.


Market Wrap
Main Pairs Movement
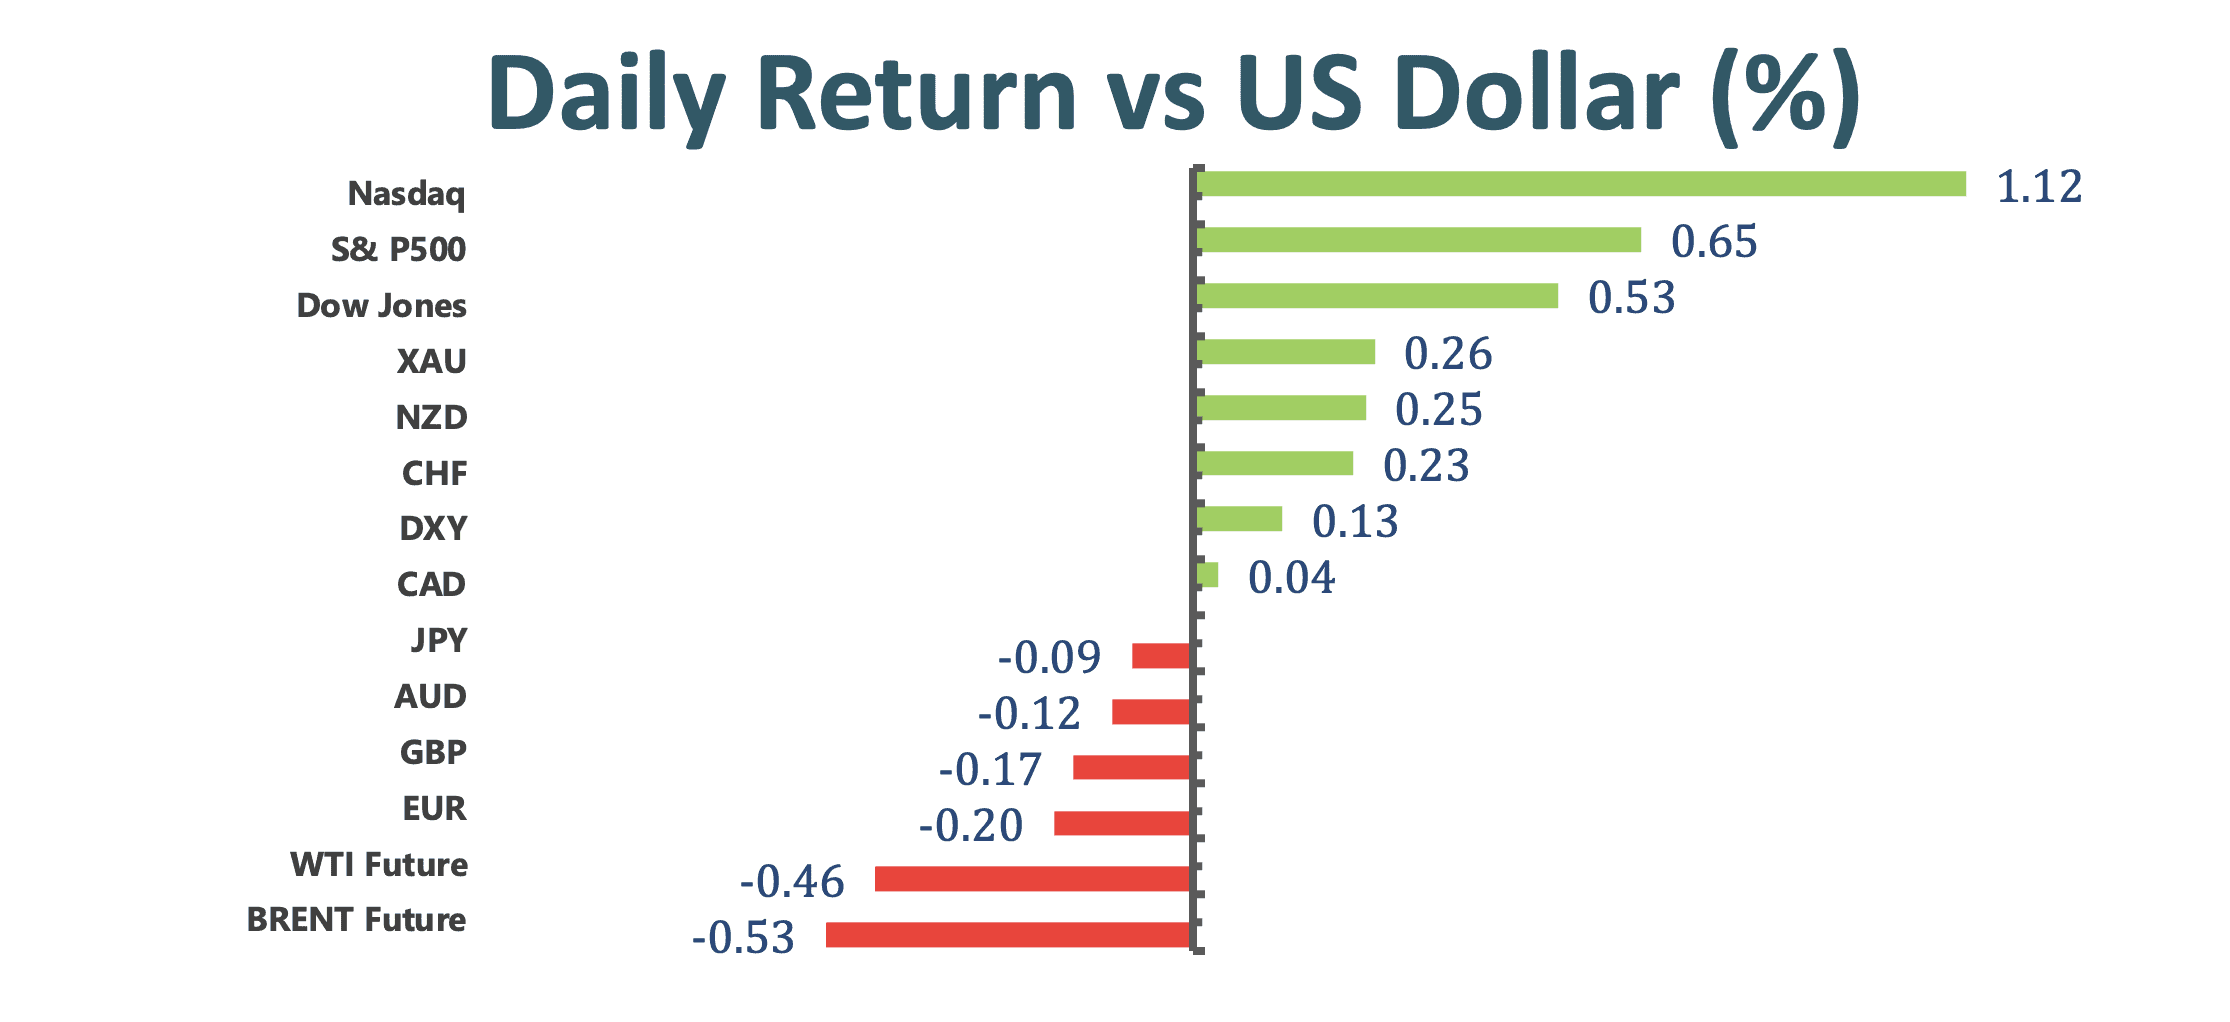
DXY opens the week on the positive footing, remainning higher against most G-10 currencies peers. The dollar is expected to stay bid into this week’s Federal Reserve policy decision, which will refrain from any explicit action to rein in yields.The precious metal, gold heads for a second straight days gain on bets that the Fed will decide to keep rates unchanged this week during the meeting. The Fed meeting will be a major driver for the gold’s movement as if rates remain low, potentially lifting the inflation rate, then it will drive the gold market upward.

After last week’s fluctuation, crude oil prices consolidate around $65 in a narrow band on Monday amid a lack of significant fundamental drivers. With a strengthen US dollar index and the news from the possibility of Iranian oil coming back onto the market, oil prices are weak today.
Technical Analysis:
XAUUSD (Daily Chart)

Gold extends its positive trend on Monday, currently trading around 1730 area. On the daily chart, the technical outlook seems to suggest that Gold might extend its recovery toward its resistance level at 1746.91 in the near- term. The RSI indicator continues to stay below overbought, mplying that there is still more room for the pair on the upside before it confronts a bearish pressure. In the meanwhile, the MACD indicator just turns to a bullish mode, suggesting that the pair has potential to grow upward. However, in the bigger picture, gold remains bearish as it continues to fall within the descending channel whilist trading below the 50 Simple Moving Average and the midline of Bollinger Band.
Resistance: 1746.91, 1790.23, 1825.24
Support: 1676.89
GBPUSD (Four- Hour Chart)

From a technical aspect, repeated failing to break the resistance at 1.3954 marks the formation of a bearish double- top pattern in the near- term. The double top formation may possibly brings the pair down to the next support level at 1.3779, and then pullback; thus, any decline is likely to find a place near the support confluence region. The MACD indicator also suggests that the bearish momentum is likely to continue. However in the bigger picture, GBPUSD remains bullish as it continues to stay in the ascending channel.
Resistance: 1.3954, 1.4008, 1.4062
Support: 1.3779
EURUSD (Daily Chart)

EURUSD retreats as the US dollar index recovers its poise, currently trading around 1.1930. On the daily chart, EURUSD continues to trade within the descending channel; at the same time, it is located below the 50- and 100- SMA, indicating a bearish mode. However, the RSI indicator stays in a neutral situation, suggesting that there is room for the pair to climb or drop. That being said, the pair might be in a consolidated mode as of now. If the pair can successfully climb above the resistance at 1.1945, then it will open a chance to contest the next resisance at 1.2349, where turns the pair from bearish to bullish in the near- term and long- term. To the downside, if the pair fails to test 1.1945, then it will potentially head toward 1.1695, which confirms a bearish trend.
Resistance: 1.1945, 1.2349
Support: 1.1695, 1.1492, 1.1290
Economic Data
|
Currency
|
Data
|
Time (TP)
|
Forecast
|
|
AUD
|
RBA Meeting Minutes
|
08:30
|
N/A
|
|
EUR
|
German ZEW Economic Sentiment (Mar)
|
18:00
|
71.2
|
|
USD
|
Core Retail Sales (MoM) (Feb)
|
20:30
|
5.9%
|
|
USD
|
Retail Sales (MoM) (Feb)
|
20:30
|
5.3%
|
|
|
|
|
|
|
|
|
|
|
|
|
|
|
|
|
|
|
|
|
|
|
|
|
|
|
|
|
|
|
|
|
|
|
|
|


