February 19, 2021
Daily Position Report
Market Focus
US stocks and bonds pared losses amid lingering concern rising borrowing costs could cap a rally that’s driven equity values to historic highs. The tech-heavy Nasdaq 100 trimmed its loss by more than half to 0.6%. The energy and technology sectors weighed on the SP 500, while utilities were in the green. A report earlier showed initial jobless claims rose more than expected. Walmart Inc. dropped after saying it will increase spending on worker salaries and automation.
Yields on 10-year Treasuries climbed as high as 1.31% before paring the increase. Yields reached the highest levels in a year earlier this week. Technology companies such as Tesla Inc., which have seen their valuations surge, are often seen as the most at risk of a pullback.
According to Peter Boockvar, chief investment officer at Bleakley Advisory Group, “This rise in rates will certainly test the mettle and staying power of the bulls.”

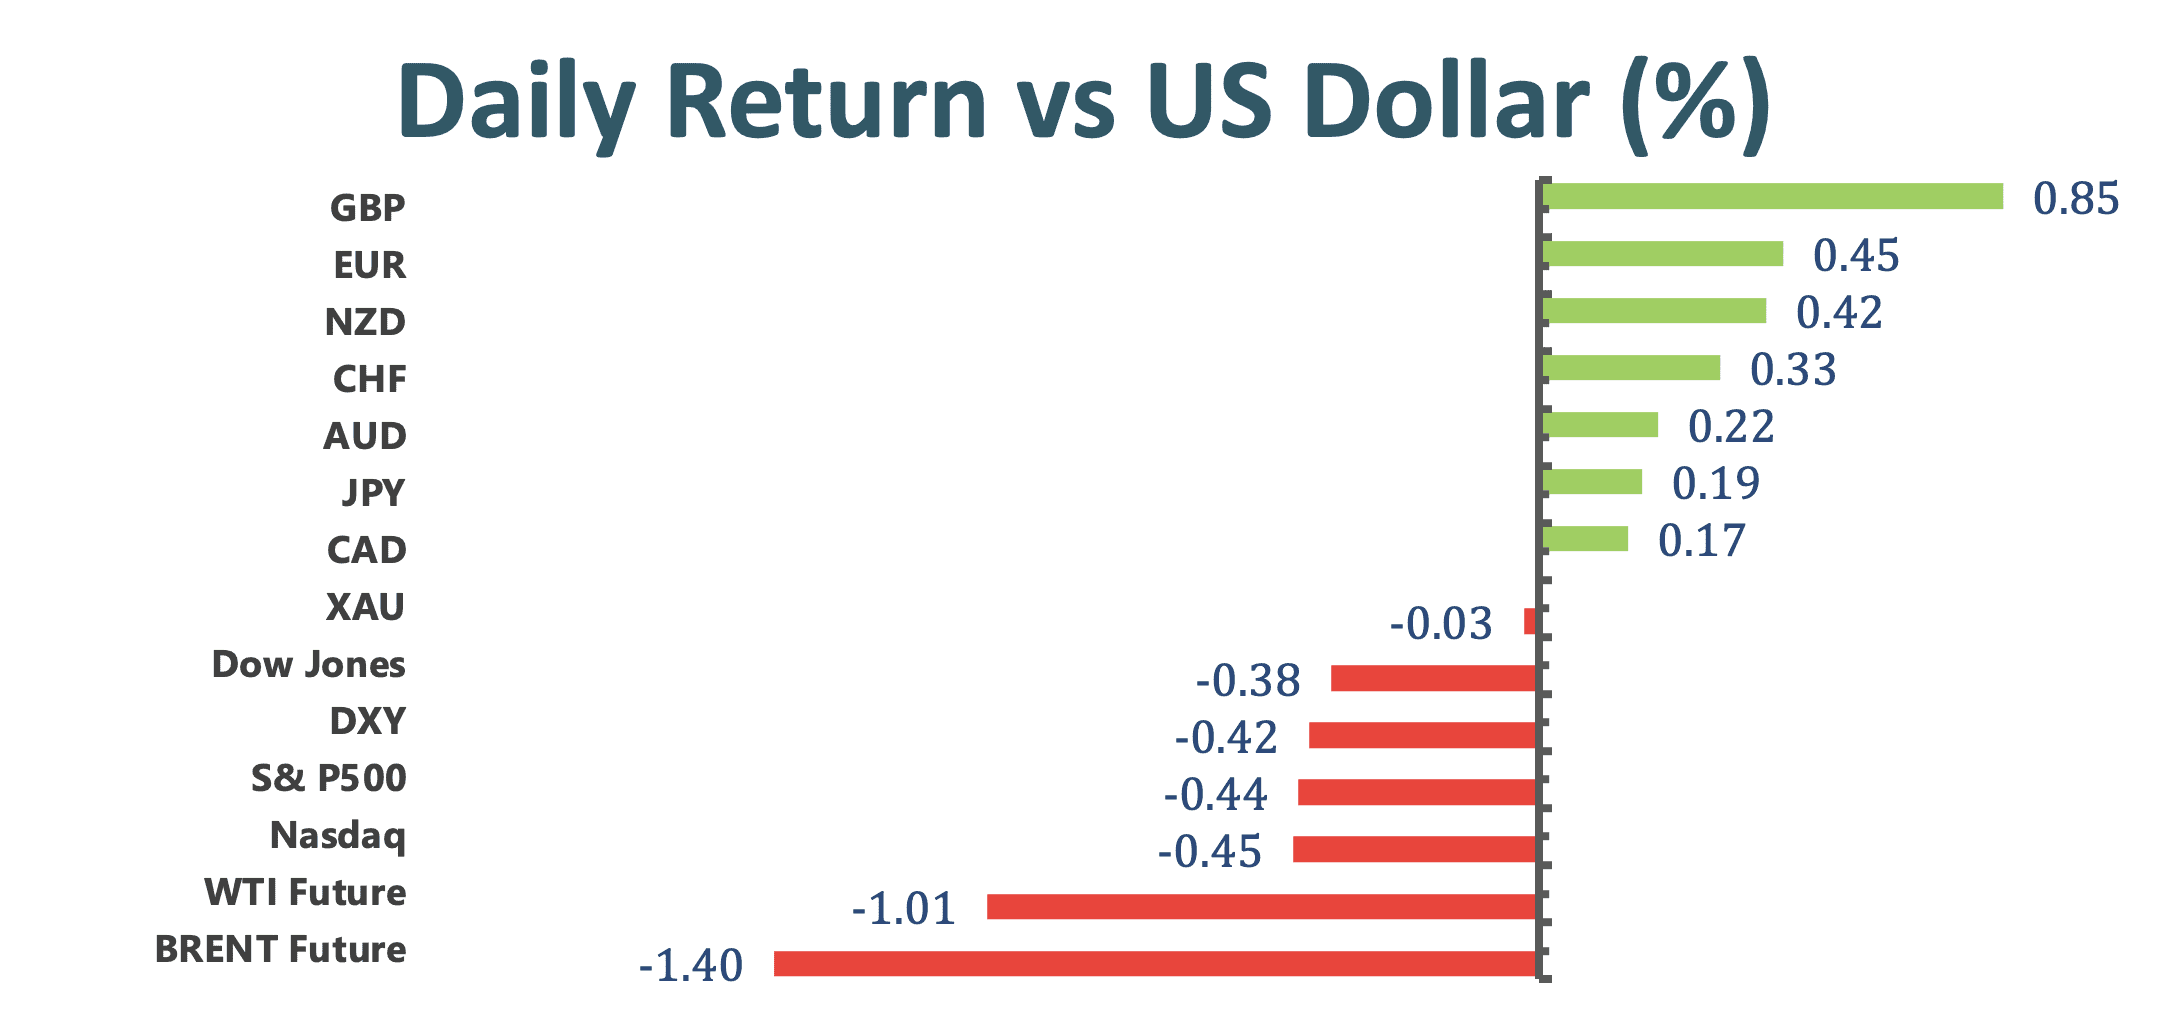
• The SP 500 Index decreased nearly 0.45%, the lowest in more than a week on the largest dip in almost three weeks.
• The Dow Jones Industrial Average decreased almost 0.4%, the first retreat in a week and the biggest dip in almost three weeks.
• The Nasdaq Composite hit 13,865.36 (-0.7%), experiencing the lowest point in two weeks.
Market Wrap
Main Pairs Movement
EURUSD is rising toward 1.21 as US jobless claims disappointed with a leap to 861,000. US Treasury yields are off the highs. AUDUSD heads into the Asian opening trading around 0.7770, as bulls refuse to give up. The pair steadies around 0.7765 ahead of Australian Retail Sales take center stage. The Loonie dropped to a daily low of 1.2660 during the early trading hours of the American session but didn’t have a hard time staging a rebound with falling crude oil prices hurting the commodity-sensitive CAD.
The greenback loses further the grip and drops to session lows near 90.50. After a stunning recent run to the upside, crude oil markets have come off the boil a little on Thursday; front-month futures contracts for the delivery of West Texas, the US benchmark for sweet light crude oil, are back below the $61.00 mark and down about 40 cent or 0.7% on the day. The yield on 10-year Treasuries gained two basis points to 1.29%.
Technical Analysis:
USDJPY (4-Hour Chart)

Extending on the previous day’s loss, USDJPY remains under the bearish pressure today. Retreating US bond yields weighed on the USD and exerted additional downward momentum on the USDJPY. At the moment, a cushion at 105.60 seems supportive as the bulls have fenced off the bears’ multiple attempts to drag USDJPY further down low in the past 12 hours. From a technical perspective, the USDJPY still enjoys a modestly bullish trend as indicated by the 21-Day SMAVG and the 50ish RSI. However, looking at the long tails of the two-prior candlestick, I would assume the USDJPY is now slowly shifting its trend downward. If the pair can break below the 105.60, it would be a confirmative signal for the bears to engage, and as a result, the price for USDJPY could dip to 105.31, then 105.13. Conversely, if an upward momentum resumes, the bulls will first meet some resistance at 105.85, followed by 106.16.
Resistance: 105.85, 106.16
Support: 105.60, 105.31, 105.13
GBPUSD (4-Hour Chart)

The Sterling continues to overwhelm the greenback on Thursday as the Cable surges above 1.3950, hitting the highest price level since early 2018. The upbeat UK coronavirus figures strengthen the markets’ expectations of a near-term UK economy reopen. There was a temporary downward correction during the early American session that was due to a modest recovery in the greenback as equity prices in Wall Street dropped further into the negative territory. The pullback was overturned, and the bulls continue to drag the Cable back near the 1.3980 territory. From a technical perspective, the Cable’s bullish trend is supported by the 15-Day SMAVG, however, with an RSI nears the 70-threshold, a downward correction is likely. In the short-term, it would not be prudent to place additional long positions at the current price level, at least not until the pair finds acceptance above 1.3979 resistance level.
Resistance: 1.4029, 1.3979
Support: 1.3922, 1.3875, 1.3849
XAUUSD (4-Hour Chart)

The Gold witnessed a modest recovery that brought the pair back near $1790 during the early European session, but the gain was immediately wiped out in the following sessions and XAUUSD now trades around $1774. Improving market sentiment and higher real bond yields put the non-yielding precious metal on the back foot. Technically speaking, the XAU/USD is going to remain on the downward slide, as indicated by the 60-Day SMAVG. However, with a below-than-30 RSI, it implies that a near-term upward correction is likely. If the XAU/USD finds acceptance above the $1779 level, the bulls can cap their gains at $1785, followed by $1797. On the flip side, if the pair continues to dive low, the most immediate cushion is $1769 then $1764.
Resistance: 1779, 1785, 1797
Support: 1769, 1764
Economic Data
|
Currency
|
Data
|
Time (TP)
|
Forecast
|
|
AUD
|
Retail Sales (MoM) (Jan)
|
08.30
|
-4.2%
|
|
GBP
|
Retail Sales (MoM) (Jan)
|
15.00
|
-2.5%
|
|
EUR
|
German Manufacturing PMI (Feb)
|
16.30
|
56.5
|
|
GBP
|
Composite PMI
|
17.30
|
|
|
GBP
|
Manufacturing PMI
|
17.30
|
|
|
GBP
|
Services PMI
|
17.30
|
|
|
CAD
|
Core Retail Sales (MoM) (Dec)
|
21.30
|
-2.0%
|
|
USD
|
Existing Home Sales (Jan)
|
23.00
|
6.61M
|
|
|
|
|
|
USD
|
Fed Monetary Policy Report
|
Tentative
|
–
|
|
|
|
|
|
|
|
|
|
|
|
|


